Your browser of choice has not been tested for use with Barchart.com. If you have issues, please download one of the browsers listed here.
Stocks | Futures | Watchlist | News | More
or

Aluminum Oct '20 (ALV20)

[[ item.lastPrice ]] [[ item.priceChange ]] ([[ item.percentChange ]]) [[ item.tradeTime ]] [COMEX]
[[ item.bidPrice ]] x [[ item.bidSize ]] [[ item.askPrice ]] x [[ item.askSize ]]
[[ rootItem.symbol ]]underlying price [[ rootItem.lastPrice ]] [[ rootItem.priceChange ]] ([[ rootItem.percentChange ]]) [[ rootItem.tradeTime ]]
Quote Overview for [[ item.sessionDateDisplayLong ]]
[[ rowChartData.labelLow ]]
[[ rowChartData.lowPriceFormatted ]]
[[ rowChartData.lowPrice ]]
[[ rowChartData.labelHigh ]]
[[ rowChartData.highPriceFormatted ]]
[[ rowChartData.highPrice ]]
since [[ rowChartData.lowDate ]]
since [[ rowChartData.highDate ]]
[[ value ]] [[ value ]]

Contract Specifications

See More
Contract
Aluminum
Contract Size
25 Metric Tons
Tick Size
0.25 (25 cents) ($6.25 per contract)
Trading Hours
5:00p.m. - 4:00p.m. (Sun-Fri) (RTH 7:10a.m. - 11:00a.m.) CST
Exchange
COMEX
Point Value
$25
Expiration Date
10/28/20 (expired)

Seasonal Chart

Aluminum Oct '20
Average Price Chart for 5 Prior Oct Contracts

Commitment of Traders Positions as of Sep 10, 2024

View Chart Details
Commercials - Long / Short
18,180 (-1,922)
20,652 (-1,965)
Non-Commercials - Long / Short
5,227 (-61)
2,800 (-143)
Producers - Long / Short
6,051 (-1,068)
16,288 (-1,398)
Swap Dealers - Long / Short
11,992 (-654)
4,227 (-367)
Managed Money - Long / Short
0 (unch)
2,236 (-22)
Other Reportables - Long / Short
5,227 (-61)
564 (-121)
Get Realtime - Quotes and Charts for Futures Traders. Learn More >>

Price Performance

See More
Period Period Low Period High Performance
1-Month
1,743.00 +3.93%
on 10/01/20
1,875.75 -3.43%
on 10/12/20
+30.25 (+1.70%)
since 09/28/20
3-Month
1,714.00 +5.69%
on 08/03/20
1,875.75 -3.43%
on 10/12/20
+75.25 (+4.33%)
since 07/28/20
52-Week
1,481.75 +22.25%
on 04/06/20
1,878.25 -3.55%
on 01/06/20
+31.50 (+1.77%)
since 10/28/19

More Aluminum Quotes

All Futures Prices
Please wait...

Most Recent Stories

More News
Stocks Moderately Lower Ahead of the Quarterly Triple-Witching Event

The S&P 500 Index ($SPX ) (SPY ) today is down by -0.13%, the Dow Jones Industrials Index ($DOWI ) (DIA ) is down by -0.17%, and the Nasdaq 100 Index ($IUXX ) (QQQ ) is down by -0.19%. Stocks today are...

AMAT : 192.42 (-2.18%)
FRO : 22.37 (-6.56%)
ADI : 226.50 (-2.98%)
TXN : 203.03 (-2.20%)
$IUXX : 19,745.03 (-0.48%)
DASH : 137.81 (+0.38%)
ZNZ24 : 114-185 (-0.14%)
GFS : 39.74 (-3.12%)
PBF : 31.90 (-5.84%)
LRCX : 768.91 (-2.55%)
VLO : 134.02 (-3.37%)
ASMB : 18.65 (+0.81%)
Gold/Silver: Are you Missing the Precious Metals Rally? Listen to this Metals Minute w/Phil Streible

Stay on top of overnight market moves and get expert analysis for the day ahead. In today’s Metals Minute, uncover essential levels, trade insights, and key highlights to keep you ahead of the game!
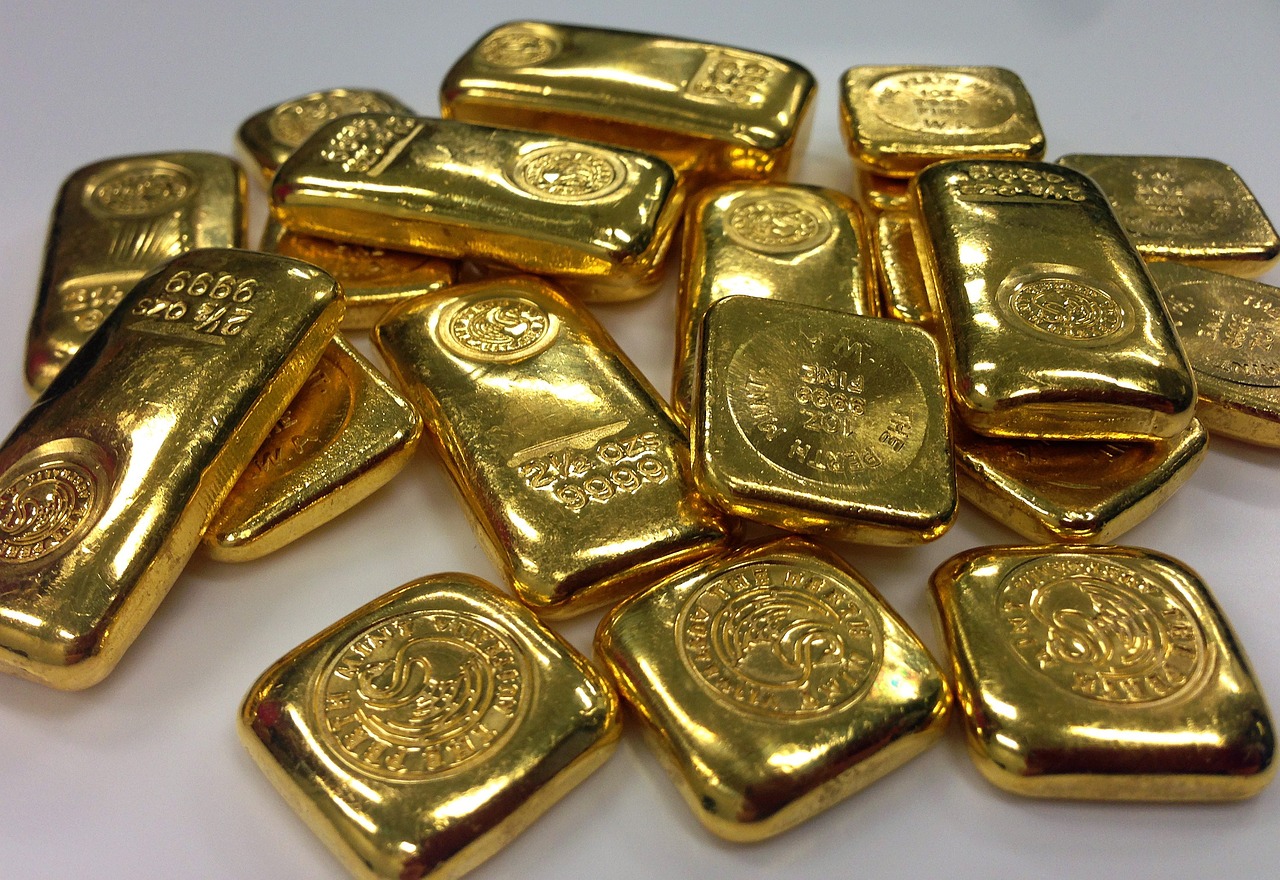
Grab This Gold Stock While It's Cheap

With gold in focus after the latest Fed rate cut, here's a look at one mining stock that could be undervalued.

GCZ24 : 2,636.3 (+0.83%)
GFI : 15.02 (+2.18%)
HGZ24 : 4.3360 (-0.25%)
Dollar Slightly Higher as British Pound Surges to a 2-1/2 Year High

The dollar index (DXY00 ) Thursday rose by +0.04%. The dollar garnered modest support Thursday after weekly US jobless claims fell more than expected to a 4-month low, a hawkish factor for Fed policy....

DXY00 : 100.954 (+0.34%)
^GBPUSD : 1.32779 (-0.04%)
^EURUSD : 1.11423 (-0.17%)
^USDJPY : 144.323 (+1.19%)
GCZ24 : 2,636.3 (+0.83%)
SIZ24 : 31.390 (-0.11%)
Gold and Crude Oil Analysis with Fibonacci & W.D. Gann Analysis

Educational and Actionable information using Fibonacci and W.D. Gann analysis.

GCZ24 : 2,636.3 (+0.83%)
CLV24 : 71.50 (-0.63%)
CLX24 : 70.65 (-0.72%)
Sentiment Speaks: Silver Is At A Major Turning Point

Silver's current structure suggests potential for a significant move, contingent on breaking resistance at 31.73 or facing a decline.

Gold $3,000 is Coming. Here's How to Invest.

Western investors, through physical ETFs, are finally joining the global gold rush led by central banks, Asian investors, and wealthy investors. Holdings of physically backed gold ETFs have risen by 90.4...

GCZ24 : 2,636.3 (+0.83%)
GCY00 : 2,610.75 (+0.92%)
TIP : 110.40 (-0.27%)
GLD : 241.44 (+0.95%)
$SPX : 5,688.55 (-0.44%)
PHYS : 20.30 (+1.00%)
Dollar Pushes Higher on Hawkish US Jobless Claims Report

The dollar index (DXY00 ) today is up by +0.36%. The dollar garnered support today after weekly US jobless claims fell more than expected to a 4-month low, a hawkish factor for Fed policy. Also, higher...

DXY00 : 100.954 (+0.34%)
^GBPUSD : 1.32779 (-0.04%)
^EURUSD : 1.11423 (-0.17%)
^USDJPY : 144.323 (+1.19%)
GCZ24 : 2,636.3 (+0.83%)
SIZ24 : 31.390 (-0.11%)
Gold/Silver: All-Time Highs or Precious Metals Crash? -Data to Watch!

Stay informed on overnight market shifts and get expert insights for the trading day ahead. Explore today’s Metals Minute for critical levels, trade strategies, and key highlights to keep you in front...

How Our Elliott Wave Analysis of Gold Nailed the Market Move

Gold has been one of the most dynamic assets in the markets recently, and getting ahead of its price action is a challenge for most traders. However, our premium members had an edge, thanks to a detailed...

Barchart Trading Guide

The Barchart Trading Guide is a Buy Signal with a Weak Signal Strength.

Key Turning Points

3rd Resistance Point N/A
2nd Resistance Point 1,811.50
1st Resistance Point 1,811.50
Last Price 1,811.50s
1st Support Level 1,811.50
2nd Support Level 1,811.50
3rd Support Level N/A

See More

52-Week High 1,878.25
Last Price 1,811.50s
Fibonacci 61.8% 1,726.79
Fibonacci 50% 1,680.00
Fibonacci 38.2% 1,633.21
52-Week Low 1,481.75

See More

Want to use this as
your default charts setting?
Save this setup as a Chart Templates
Switch the Market flag
for targeted data from your country of choice.
Open the menu and switch the
Market flag for targeted data from your country of choice.
Want Streaming Chart Updates?
Switch your Site Preferences
to use Interactive Charts
Need More Chart Options?
Right-click on the chart to open the Interactive Chart menu.
Use your up/down arrows to move through the symbols.

Free Barchart Webinar