
Let me say the quiet part out loud: The Nasdaq-100’s (QQQ) intraday volatility should have every trader and investor on high alert.
NYSE issues a pre-market daily advisory direct from the trading floor.
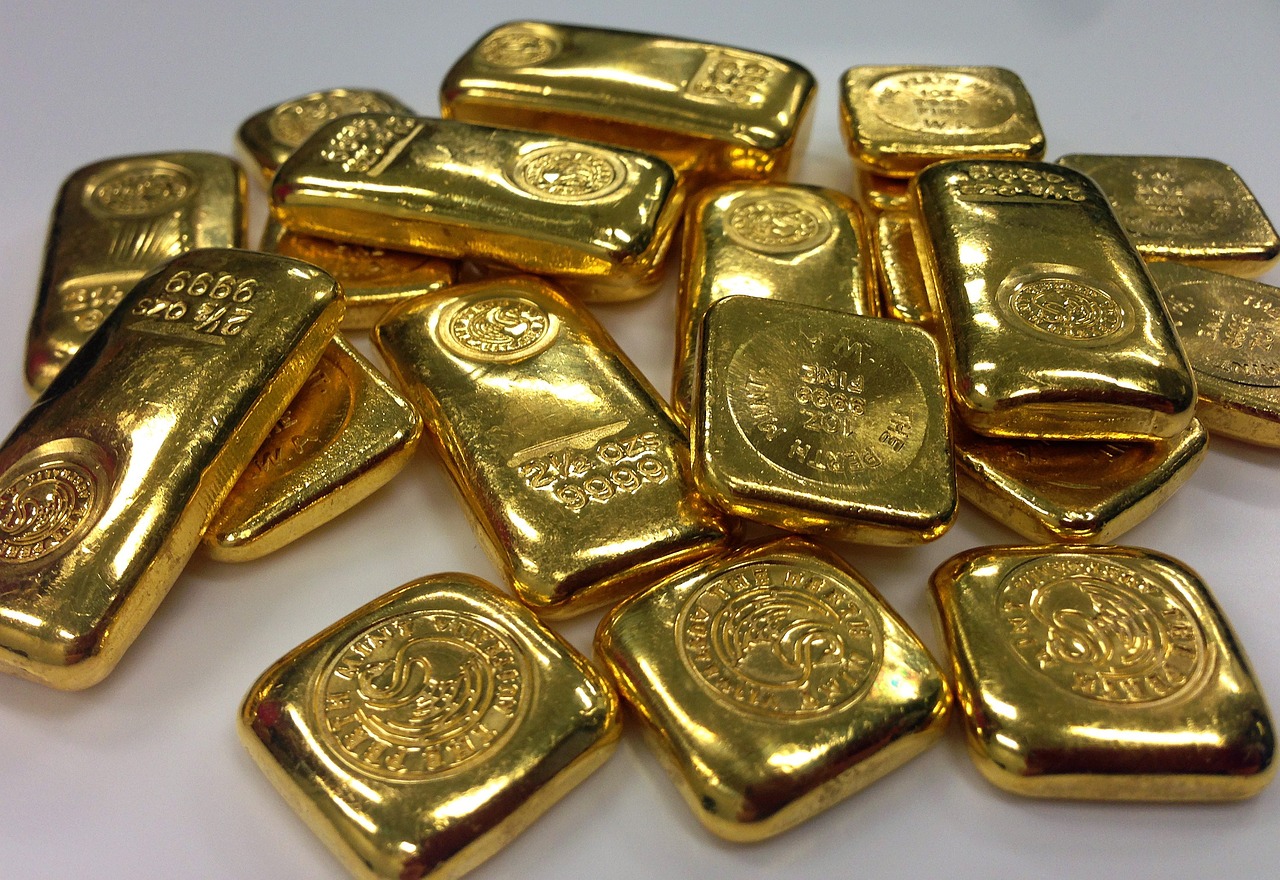
Gold’s price dropped by over $1,500 per ounce from the late January record high to the March low. In April and May, gold prices have consolidated in an under $470 range. At near $4,500 per ounce, gold...

The best days of the gold trade are firmly in the rearview mirror.
GDX remains a cornerstone of VanEck’s ETF lineup, which spans emerging markets, commodities, thematic, income, digital assets and more.
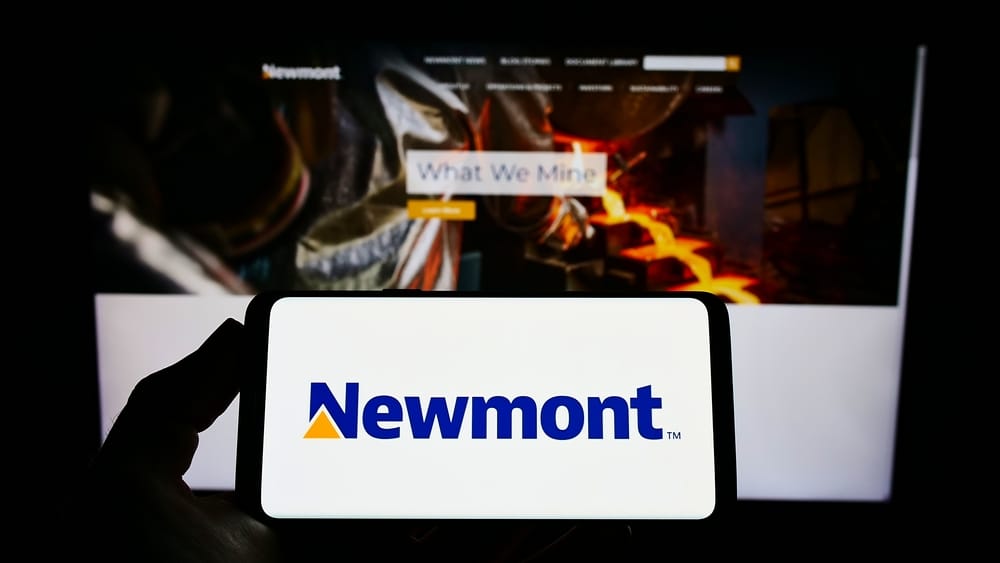
As Newmont has notably outperformed the broader market over the past year, Wall Street analysts maintain a highly optimistic outlook about the stock’s prospects.

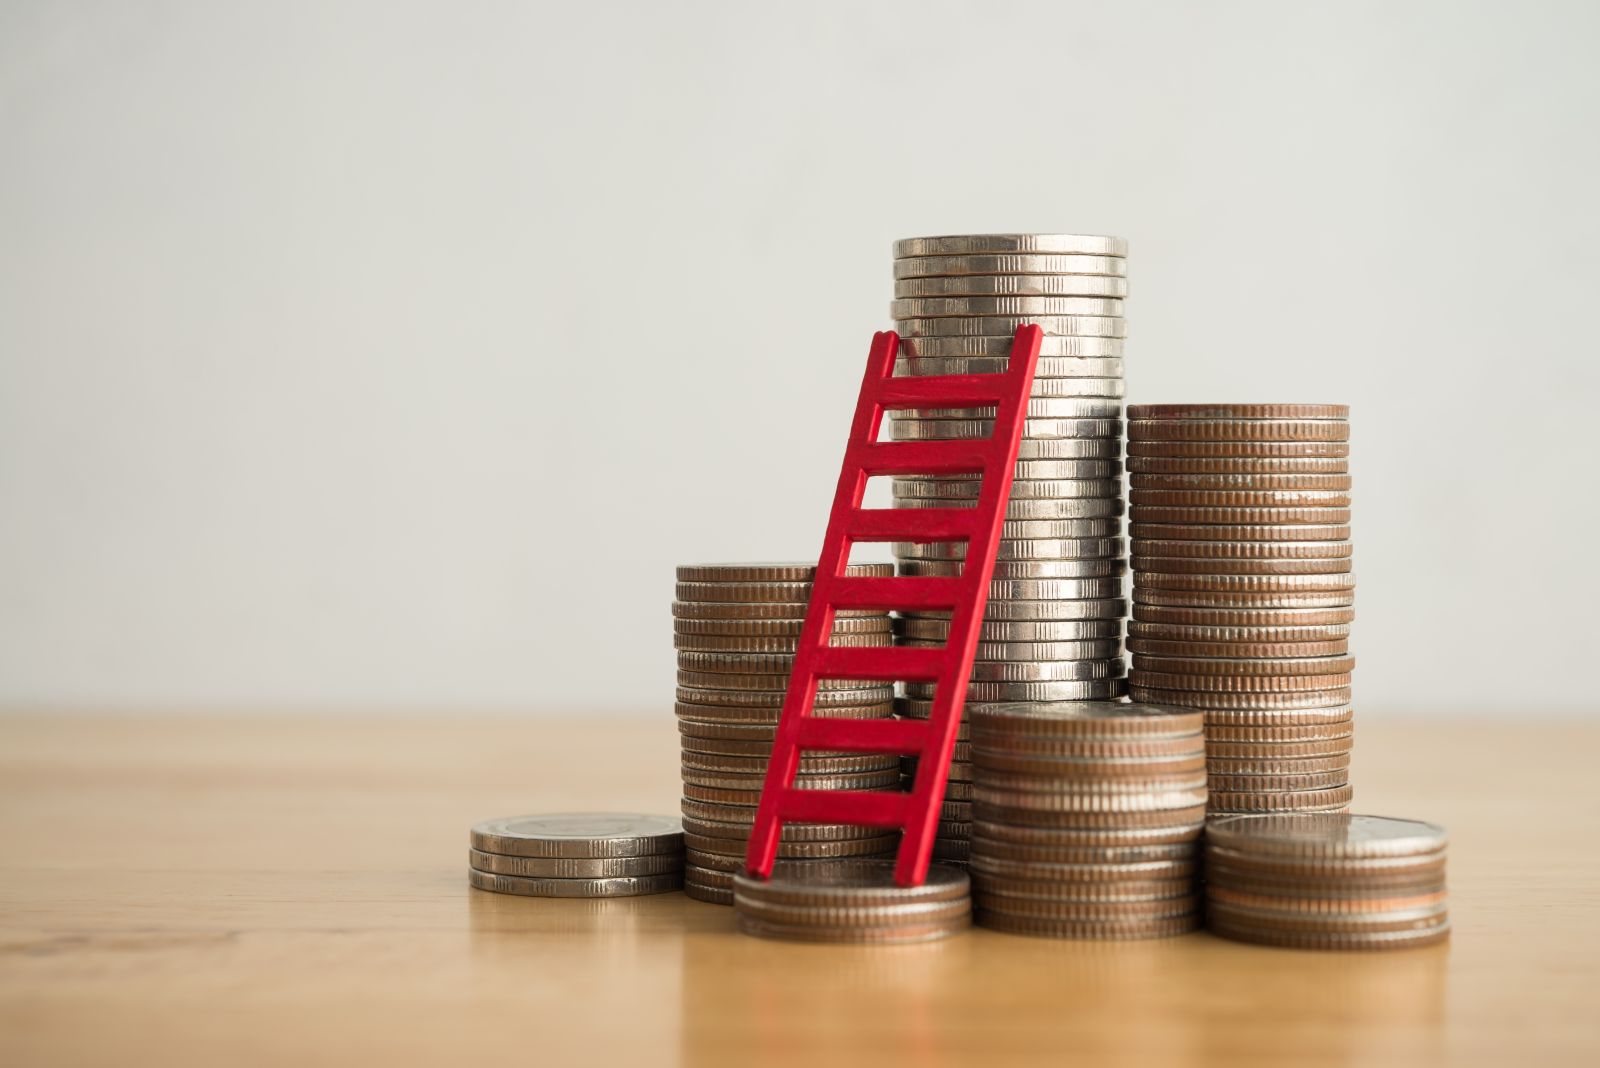
I firmly believe that portfolio creation, allocation, and rotation among assets over time will provide significant performance advantages, over those who simply buy something because it sounds good.

The exchange-traded fund industry may have a "dirty little secret." Here's what to know about what's happening with ETFs right now.

Gold’s pullback may be temporary as rising U.S. debt, inflation risks, and geopolitical tensions support a longer-term bullish outlook
AngloGold Ashanti stock has fallen over 33% from its 2026 highs. Is the stock a buy after the decline?