
As I see it, “diversification” has become a casualty of the indexing age. But that hasn’t stopped investors from pursuing it. I’ve sat quietly for a while, not really pressing my case. But that’s over. Here it is, an obituary of sorts for portfolio diversification.
If you own the five biggest tech-focused ETFs — QQQ, XLK, VGT, FTEC, and SMH — you likely believe you have a balanced exposure to different parts of the growth engine. The reality is far less exciting. As of late March 2026, these funds have morphed into different beta versions of the exact same trade, highly correlated and increasingly vulnerable to the same single point of failure.
The data confirms that the engine of the entire tech market is now a tiny cluster of mega-cap names. This has turned the variety of tech ETFs into a distinction without a difference. Here’s a chart comparing all five.
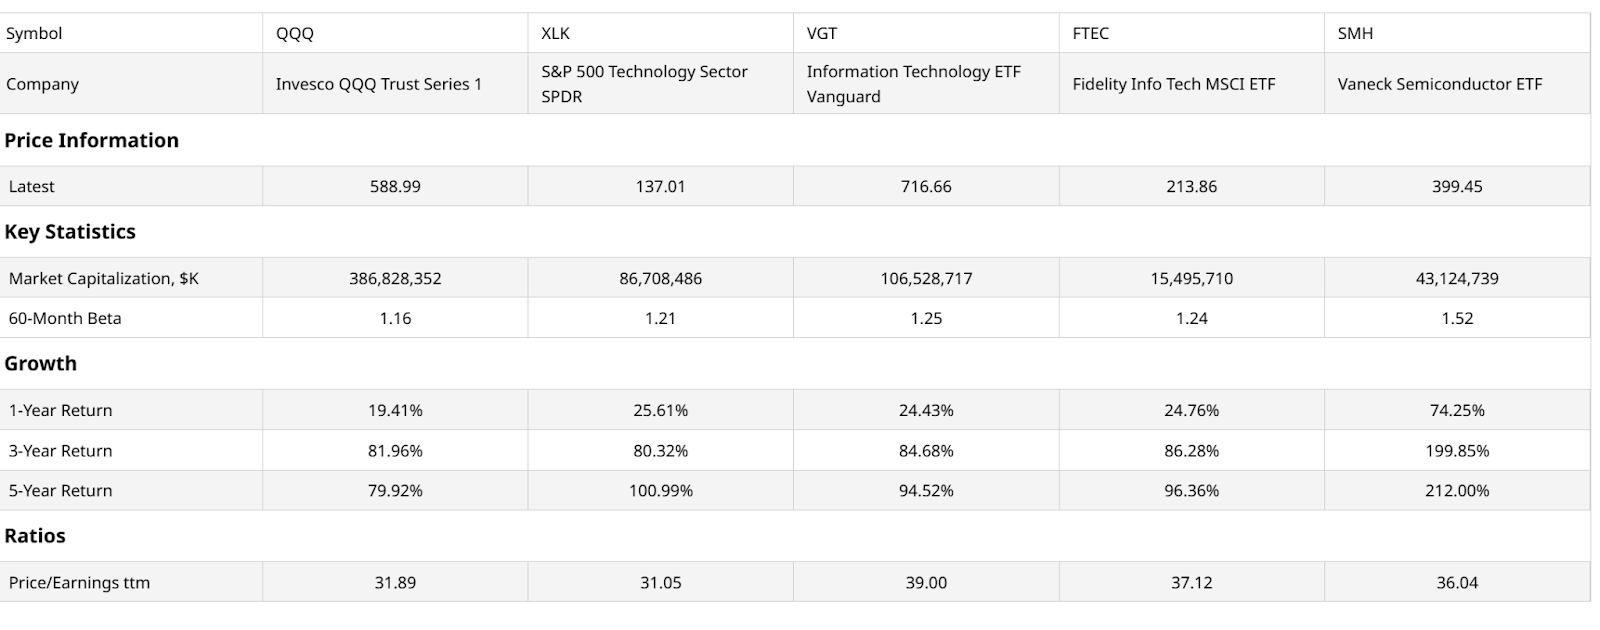
Key takeaways for me are as follows. Price-earnings ratios are similar, and long-term returns are too. What’s that you say? The Vaneck Semiconductor ETF (SMFG) did much better? Of course it did, it took more risk since semiconductor stocks in index form have been the best industry within the tech sector. That’s the higher beta you see in the chart, north of 1.5. That implies that SMH has been 50% more volatile than the S&P 500 Index ($SPX) over the past 5 years.
I am not trying to imply that there is no “daylight” between these 5 giant tech ETFs. Only that the daylight is very much like in the Nordic countries during winter. There’s some light but not a lot of it, compared to the rest of the year.
The Invesco QQQ ETF (QQQ) is the “benchmark” and the next 3 have R-Squared levels of 97%-99%. That means when we ask the question “how much of what this ETF did is explained by the movement of QQQ, and not factors specific to that individual ETF?” the answer is “nearly all of it” (97%-99% of it, at least). SMH is moderately lower due to the aforementioned differences. But it is not night and day.
The Correlation Trap: Five Tickers, One Soul
While these ETFs track different indexes, their price action has become almost indistinguishable. If we look under the hood, we see why.
Here are QQQ’s top 10 holdings.
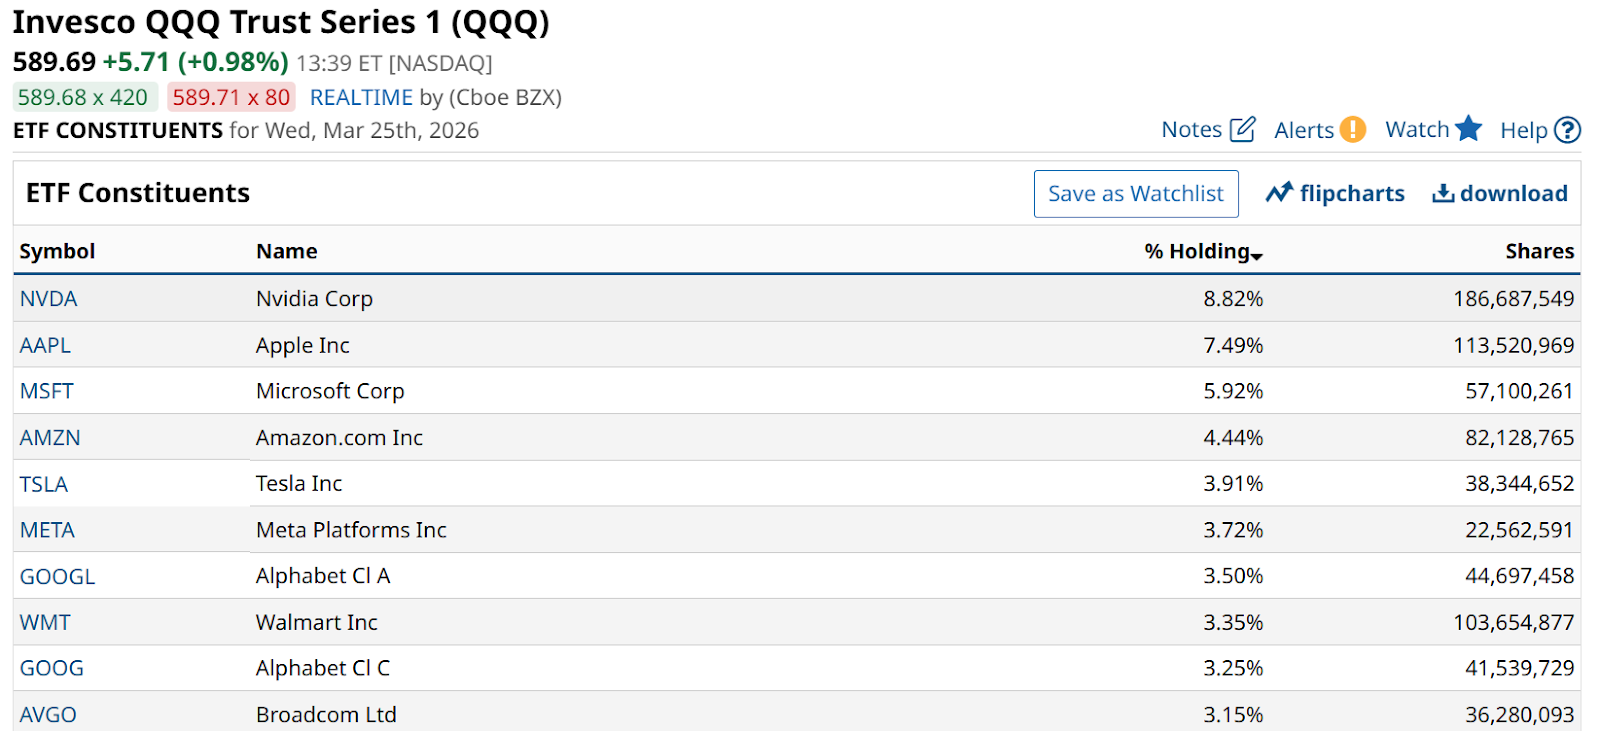
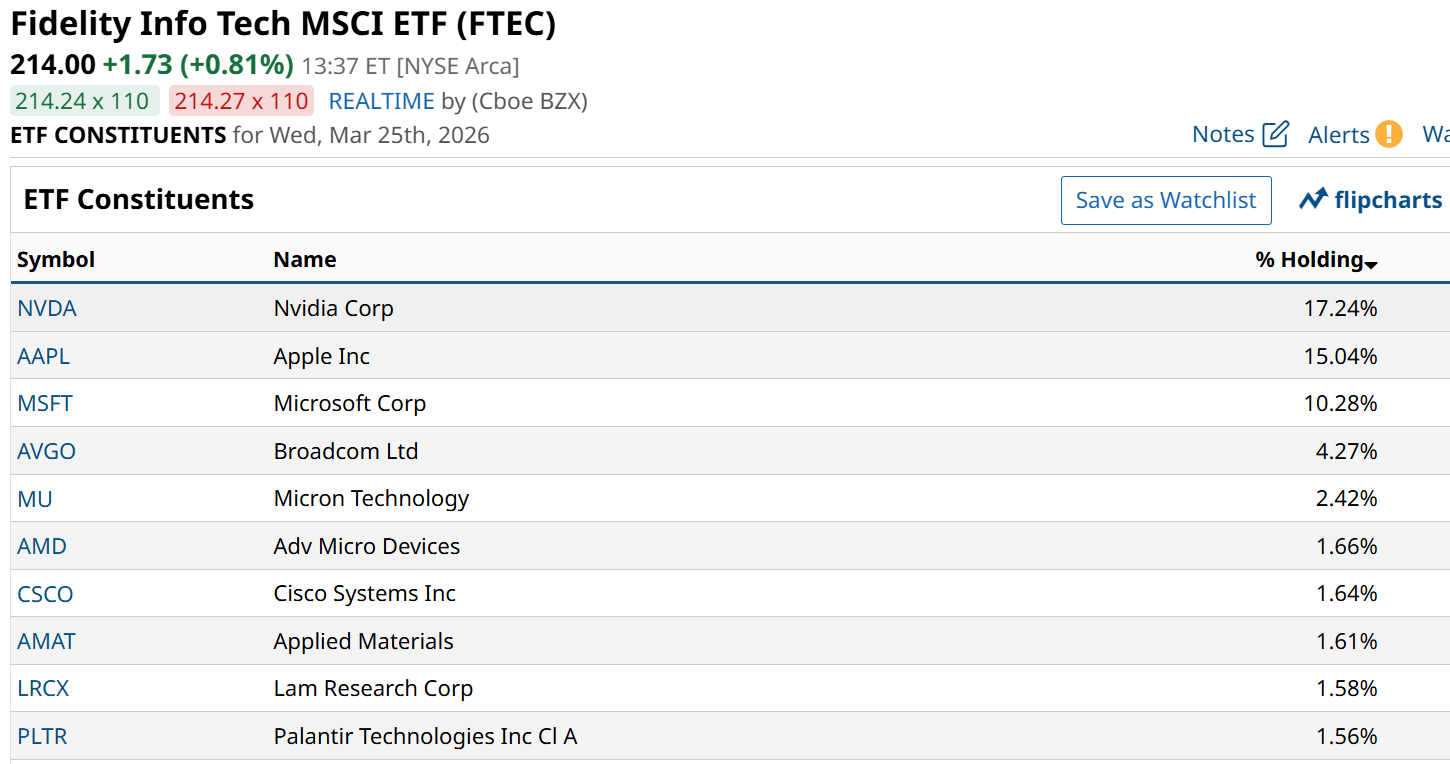
Here’s the Fidelity MSCI Information Technology Index ETF’s (FTEC) top 10 names. I chose this one because even though its top 3 holdings are identical to QQQ, here they comprise 43% of assets. In QQQ this mighty trio only amounts to about half that.
So to me, for FTEC to have a very high R-Squared to QQQ, it has to be due to a high level of “sameness” in price trends among the broader list of ETF holdings. Or, a big tech game of “follow the leader.”
As for QQQ, its ROAR Score path year to date is instructive, in that this is the bellwether for tech stocks. That’s the case even though it has other non-tech names sprinkled in.
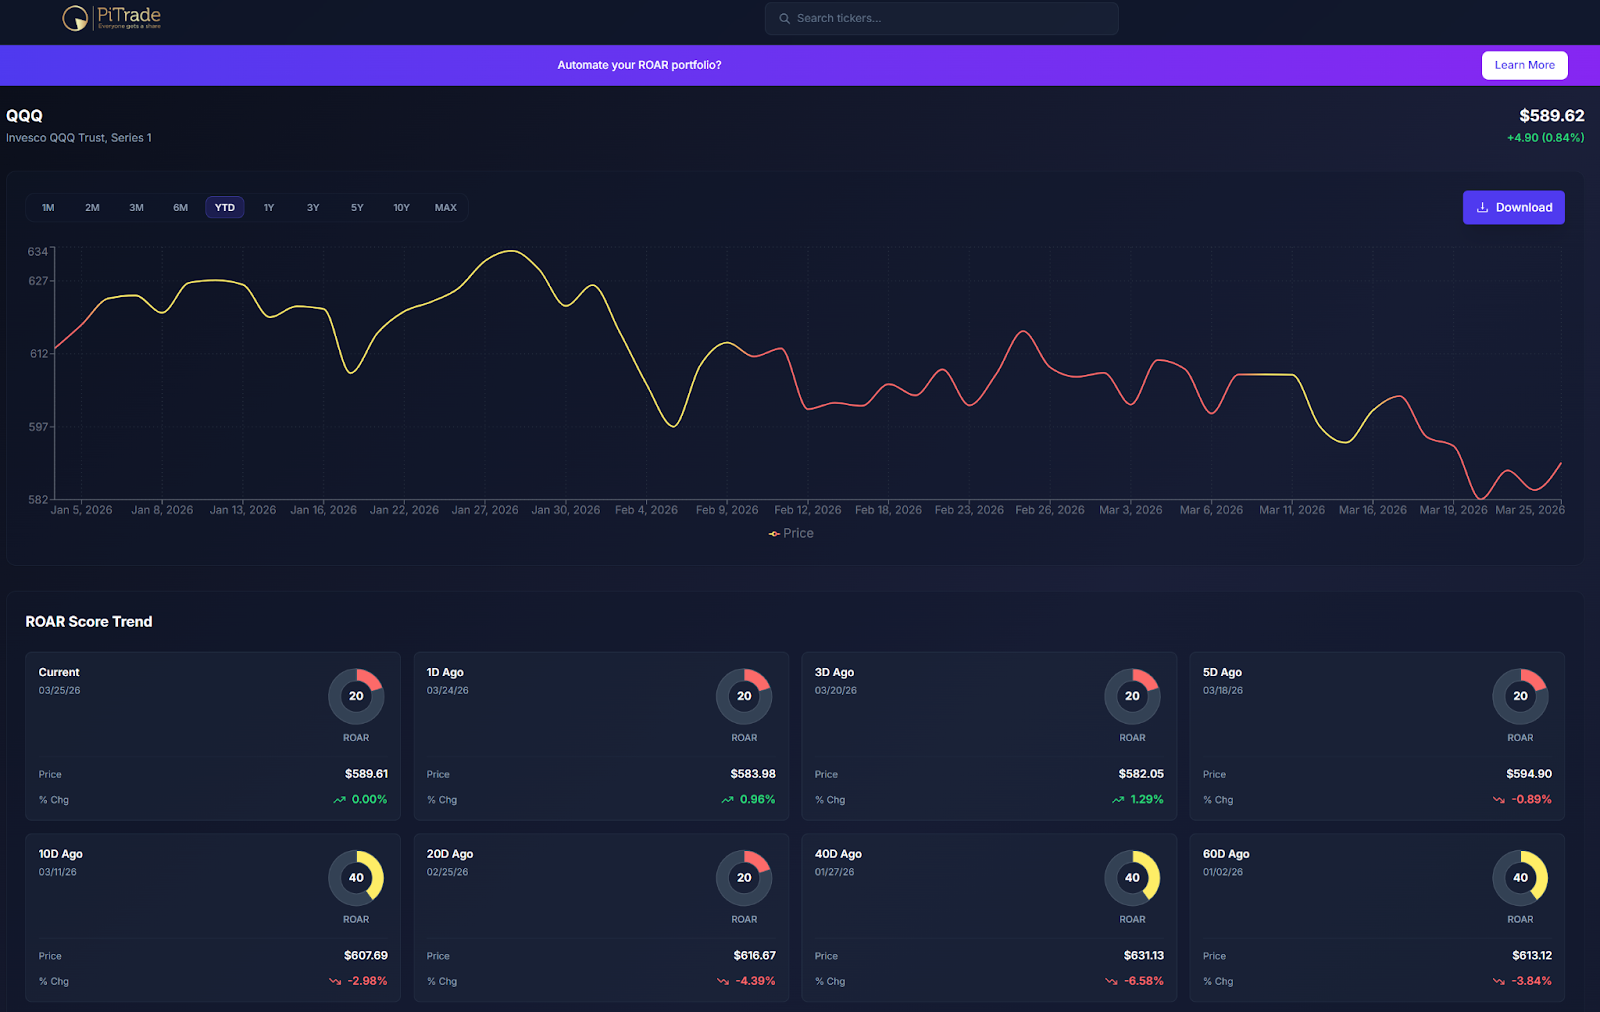
ROAR started the year in the red zone (higher risk) but was on the bubble, as evidenced by its quick shift to the yellow zone (neutral risk). That persisted only for 5 weeks, when the warning signs started to appear, by way of a drop back down to the 20 level.
As is the case with technical analysis systems, including my ROAR creation, there are always periods of intermittent “indecision.” That’s why I am less a “binary” decision investor, preferring to hold at least some allocation to my main ETF positions at all times. But to raise and lower those allocations based on input from the ROAR Scores I view every trading day.
In this case, QQQ’s latest trip to the “red zone” occurred in early February at around the $614 price level. So at $590 as I write this, it’s down only 4% from that level, and about 7% since its January peak.
That tells me there’s a good chance this decline is not finished. And that has implications for those who do not realize they own the same thing in many different ticker forms.
The Wasted Research of Overlapping Baskets
This level of correlation is the ultimate proof of why granular stock or ETF research is often a wasted effort in a trending market. If you hold the Vanguard Information Technology Index Fund ETF (VGT) and FTEC together, you aren’t diversified; you are simply redundant. They both track the same MSCI US Investable Market Information Technology Index. That seems obvious when we read it, but it is not the type of thing investors are typically taught. They have to figure it out themselves, and usually following a period where they are left wondering “why did these ETFs all go down together, I thought I was diversified.”
The stock market hasn’t vanished, but it has consolidated. When you buy “tech” in 2026, you are no longer buying an industry. You are buying a single, high-beta momentum factor.
Keep that in mind when shopping for growth ETFs. If they all grow the same way, that feels good on the way up. On the way down? Not so much.
Rob Isbitts created the ROAR Score, based on his 40+ years of technical analysis experience. ROAR helps DIY investors manage risk and create their own portfolios. For Rob's written research, check out ETFYourself.com.
On the date of publication, Rob Isbitts did not have (either directly or indirectly) positions in any of the securities mentioned in this article. All information and data in this article is solely for informational purposes. For more information please view the Barchart Disclosure Policy here.
/AI%20(artificial%20intelligence)/AI%20technology%20concept%20by%20NMStudio789%20via%20Shutterstock.jpg)


/Space/Planet%20earth%20with%20flying%20rocket%20by%20Sergey%20Mironov%20via%20Shutterstock.jpg)