
Get ready for a shocking statistic:
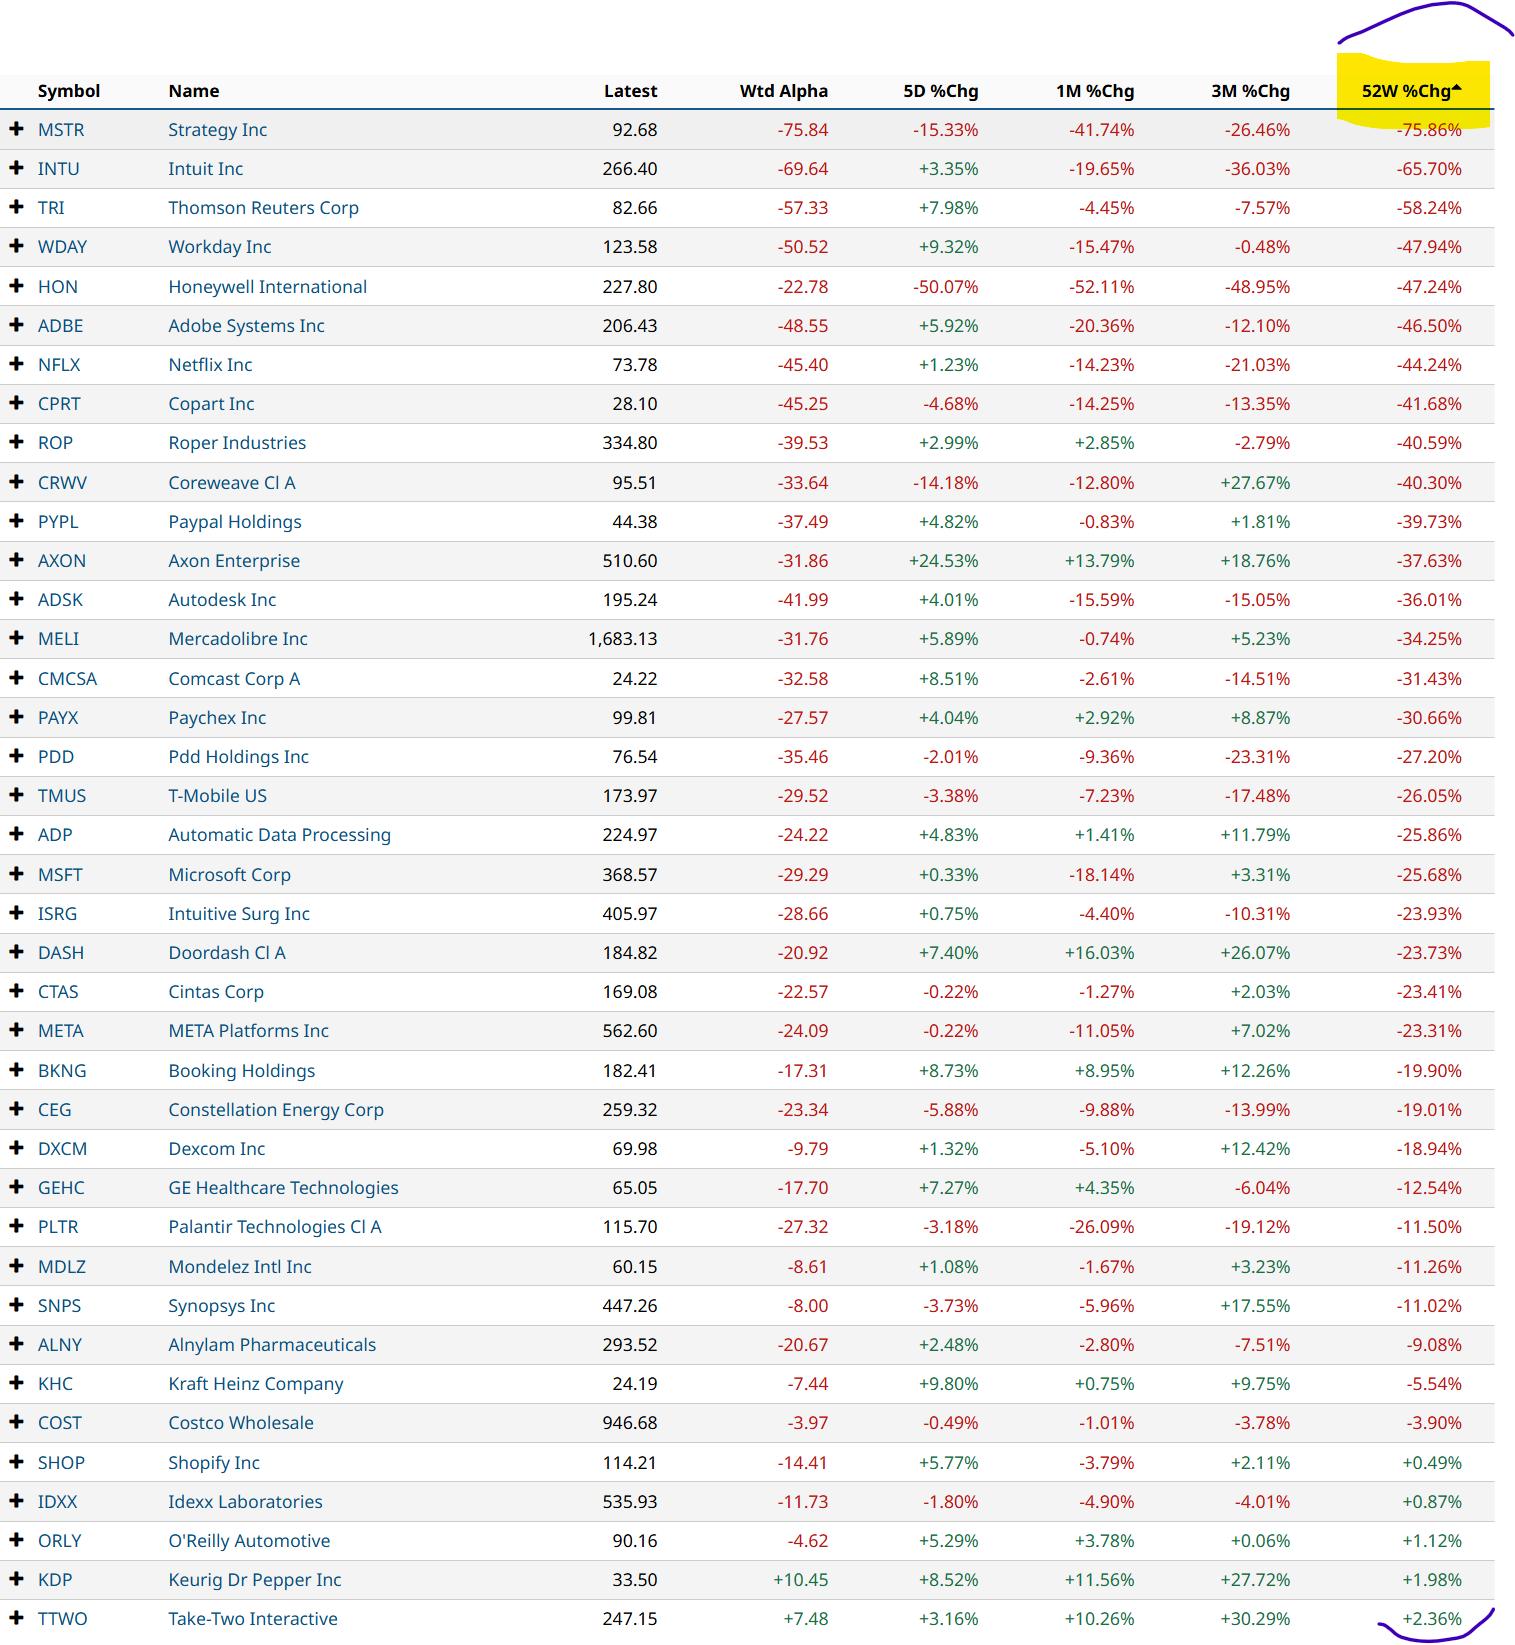
Over the past 52 weeks, U.S. Treasury bills have outperformed 39 companies within the celebrated Invesco QQQ Trust (QQQ), which tracks the Nasdaq-100 Index ($IUXX).
After more than a decade of cash-adjacent investments yielding zero, it’s time for investors to realize there’s finally potential in T-bills. Enough potential, that is, to warrant a hard look at their performance against the broader stock market.
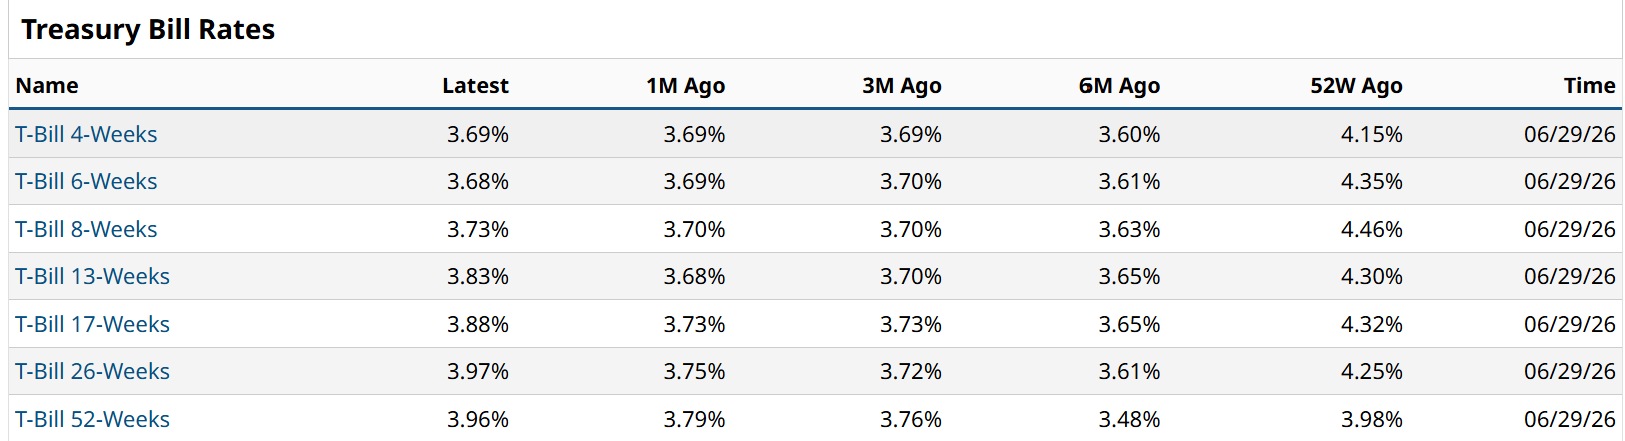
3-month T-bills approaching a 4% yield is akin to getting paid 1% a quarter to just wait and see what comes next. For many investors, this is absolutely worth allocating to.
But, chances are, many (if not most) investors won’t realize this opportunity exists until it’s too late.
T-bills are sitting there quietly yielding nearly 4% and no one is paying attention. Equity valuations are stretched, with star stocks like Micron (MU), Sandisk (SNDK), and Advanced Micro Devices (AMD) featuring trailing price-earnings ratios as high as 150x. These stocks are at astronomical heights but they carry unprecedented risk and volatility.
This continues to remind me of market cycles from the past, like the dot-com bubble burst and the collapse of 2008. Investors have had 16 years of relative rosy conditions. If that changes, what will QQQ-focused investors do?
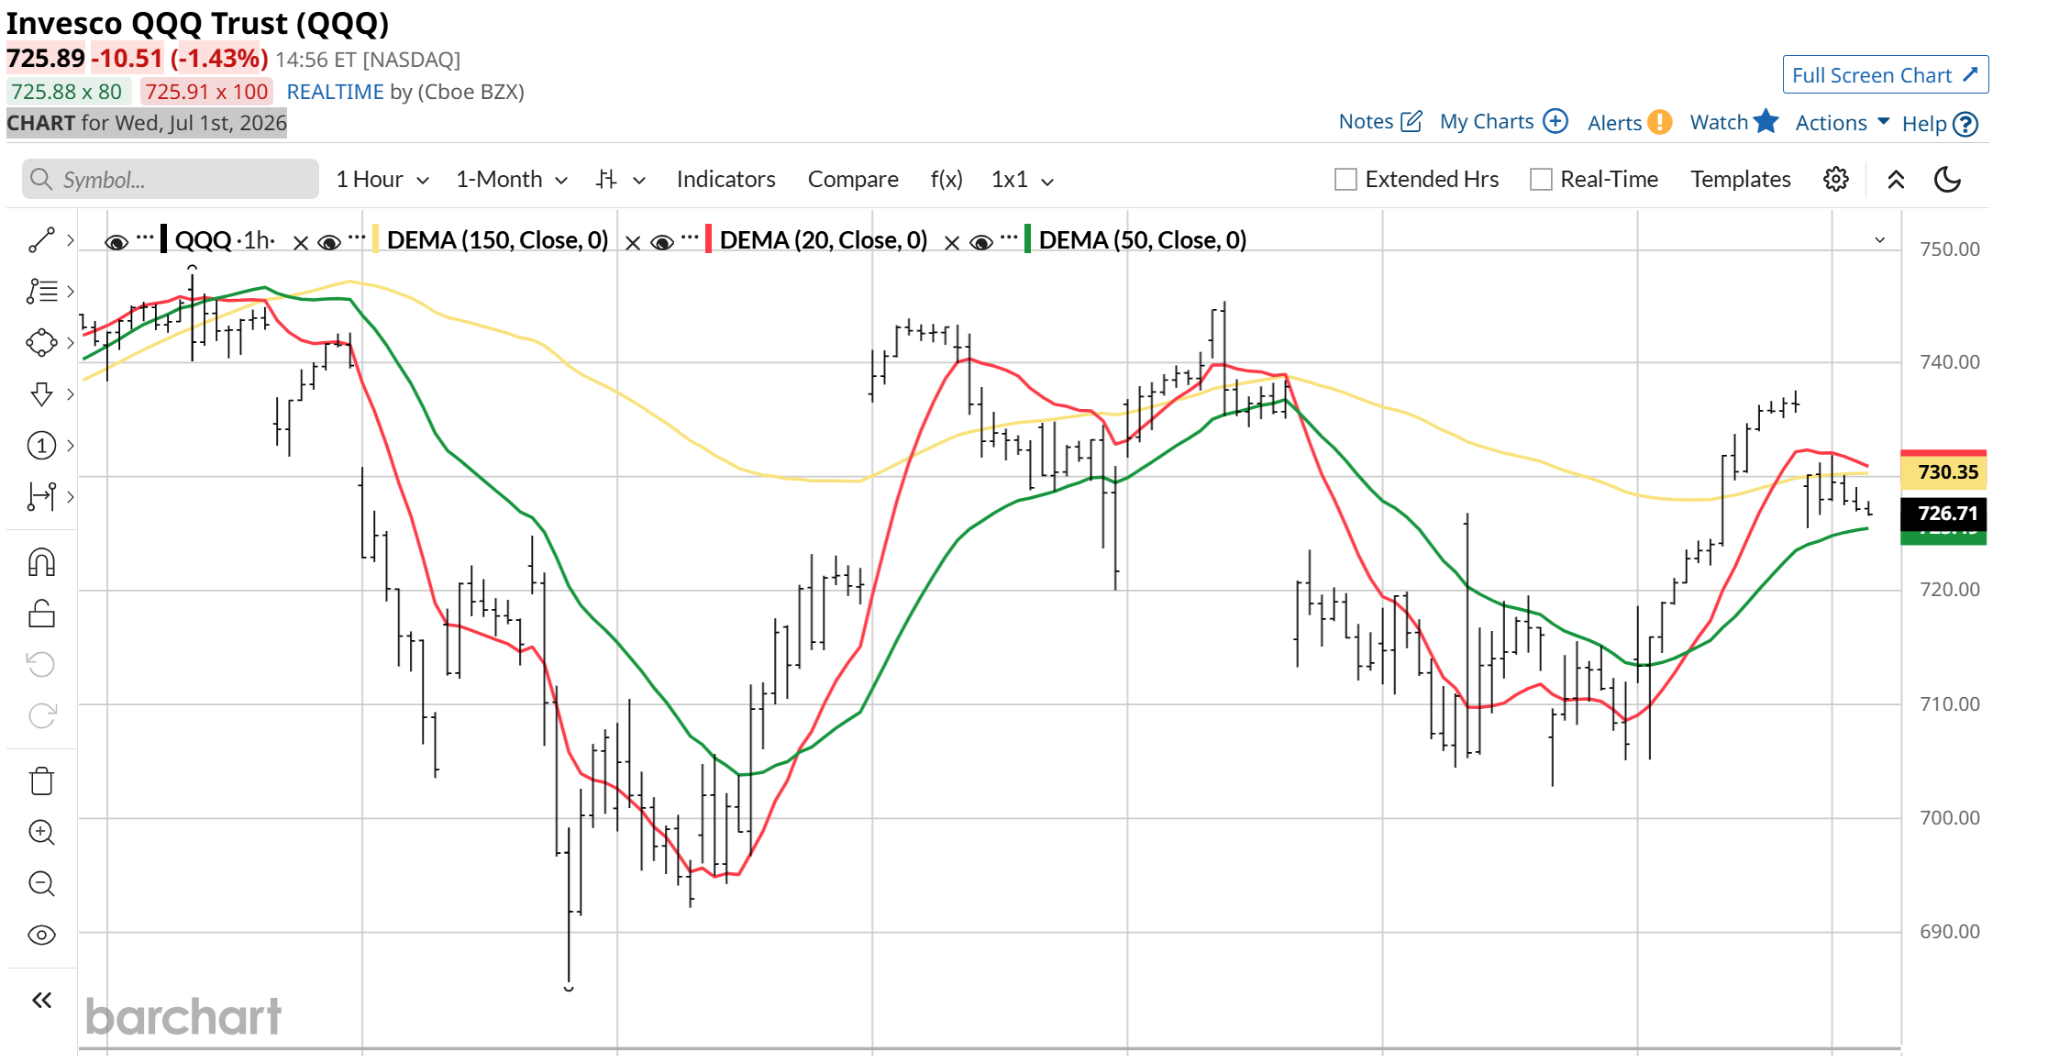
Look at what just occurred with the QQQ during June. On the chart below, you can see the ETF making an 8% round trip followed by another one of 5%. QQQ ended June almost exactly where it started. Lots of movement, no net gain.
This is the behavior that worries me, price action that is symptomatic of a late-stage market rather than an early stage market finding its bullish wings.
Because the index is market-cap weighted, a handful of multitrillion-dollar companies mask the widespread, internal degradation occurring across the rest of the market. While everyday allocators assume they are buying a powerhouse basket of 100 unstoppable growth corporations, the reality under the hood is that 40 of those exact same stocks couldn’t even outperform a guaranteed U.S. government debt contract.
The Death of a Salesman
QQQ has been operating like a slick salesman. It is up 32% over the past year, but it is not quite a team effort, as we saw above.
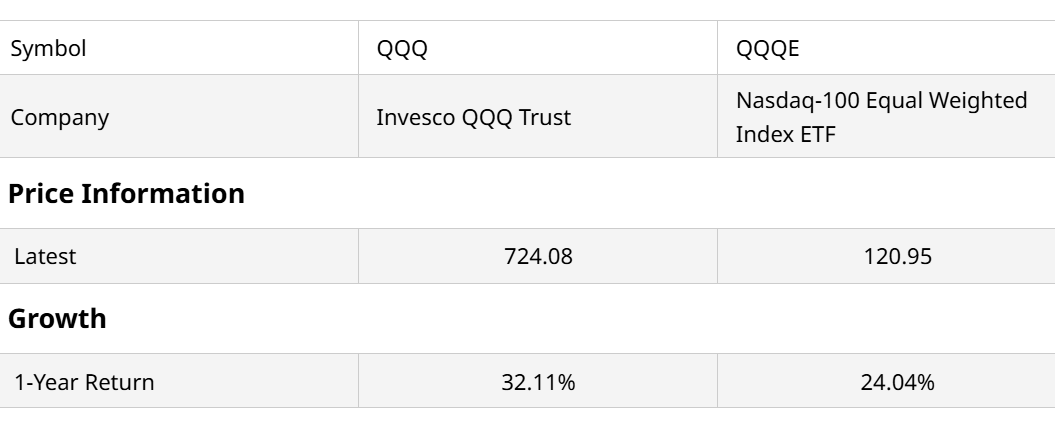
I’m showing the Nasdaq-100 Equal Weighted Index ETF (QQQE) beside it here, since it tracks the average stock within the QQQ. However, with a bit of Houdini-esque flair, it too is up 24% the past 12 months. This shows us how wide the chasm is between the “haves” and “have nots” in the market.
So what do you do if you are similarly worried? If you appreciate the historical brilliance of QQQ but know not to trust it fully?
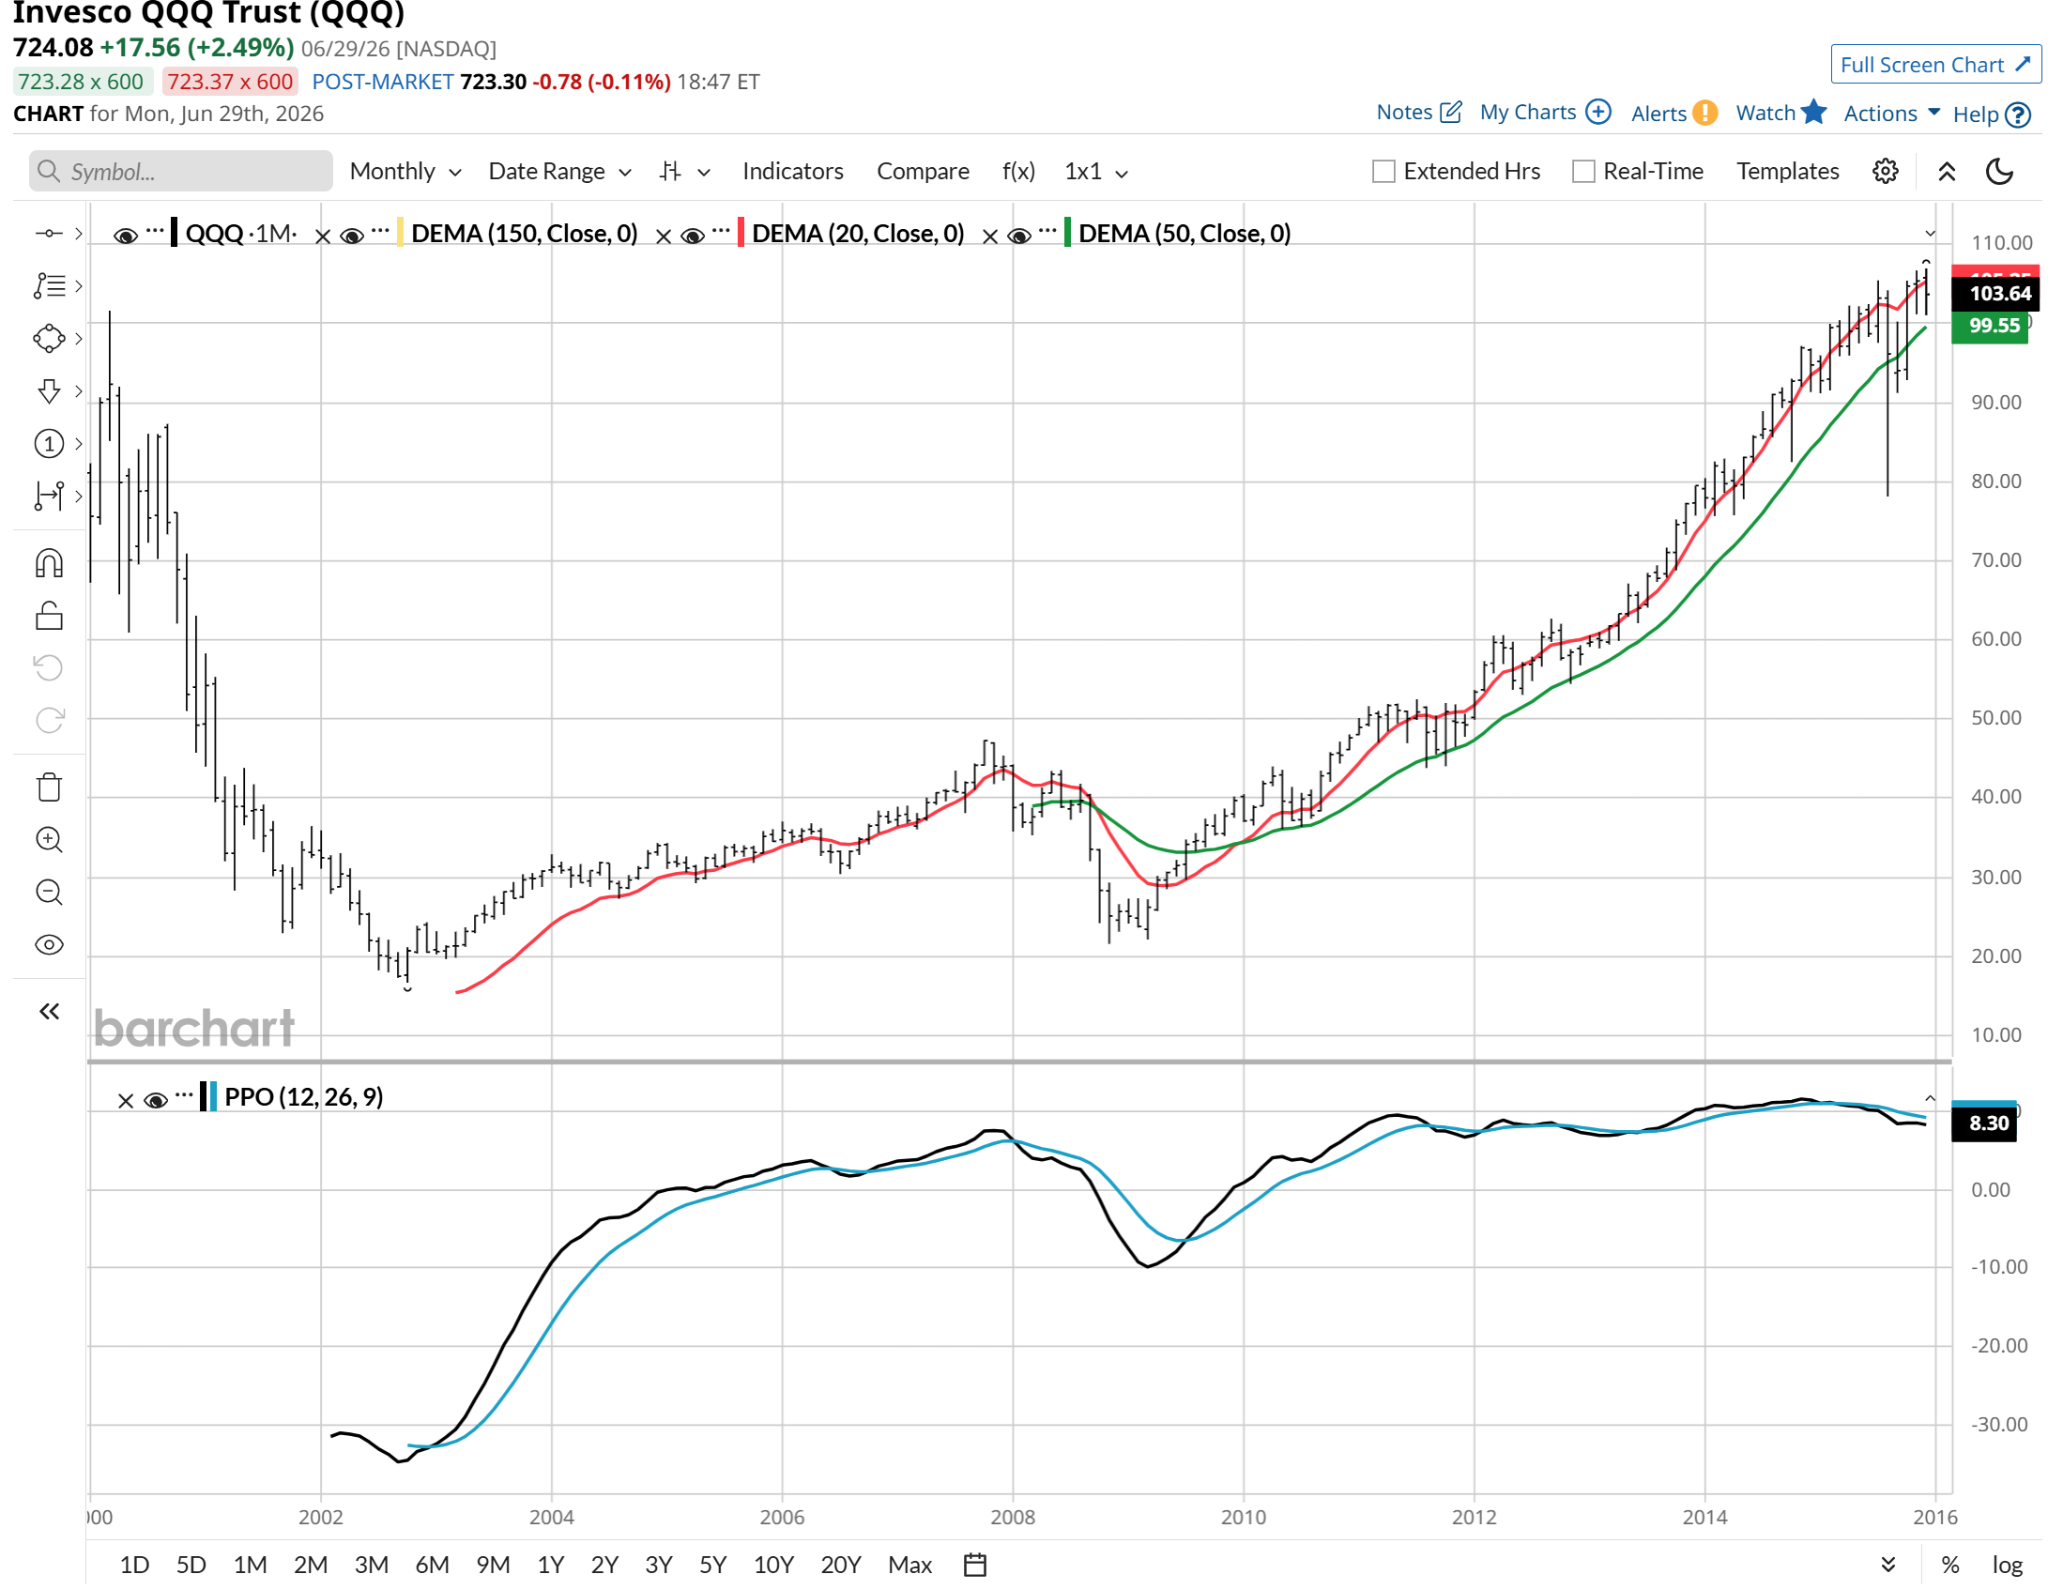
That’s the start of the year 2000 through the end of 2015. 16 full years. QQQ’s return over that time? About zero! At least from the March 2000 top. This is a history lesson about double-checking your portfolio posture when one indicator after another says “overvalued.”
For those looking to add some boring but friendly cash-like yield to their ETF mix, the State Street SPDR Bloomberg 1-3 Month T-Bill ETF (BIL) and the iShares 0-3 Month Treasury Bond ETF (SGOV) are among the popular ones. I also track the iShares 0-1 Year Treasury Bond ETF (SHV), which covers the gamut from 0-12 month T-bills, while the other pair of ETFs focus on the very short end (0-3 months).
This is not a “sell your QQQ” message. It is a suggestion to look inside the market, go behind the headlines, and know what you own. Sometimes it doesn’t hurt to remember the old adage, “cash is king.”
Rob Isbitts created the ROAR Score, based on his 40+ years of technical analysis experience. ROAR helps DIY investors manage risk and create their own portfolios. For Rob’s written research, check out ETFYourself.com.
On the date of publication, Rob Isbitts did not have (either directly or indirectly) positions in any of the securities mentioned in this article. All information and data in this article is solely for informational purposes. For more information please view the Barchart Disclosure Policy here.
/Microsoft%20headquarters%20By%20Peter.jpeg)
/NVIDIA%20Corp%20logo%20outside%20building-by%20BING-JHEN_HONG%20via%20iStock.jpg)
/Micron%20Technology%20Inc_%20logo%20on%20building-by%20vzphotos%20vis%20iStock.jpg)
/Amazon%20-%20Image%20by%20bluestork%20via%20Shutterstock.jpg)