
How has the stock market done over the past 4.5 years? If you answered “great,” I know where you are looking. At the S&P 500 ($SPX) or growth-oriented index funds. You’re probably focused on the biggest U.S. stocks. Because if you look anywhere else, frankly, it’s a mess.
It has been for a long time. Long enough so that we need to talk about it seriously. Because this table, a summary of a study I published recently, essentially says “stock picking” has been a coin flip since the start of 2022. Not coincidentally, that’s when interest rates climbed off the mat and again became competition for the broader stock market.
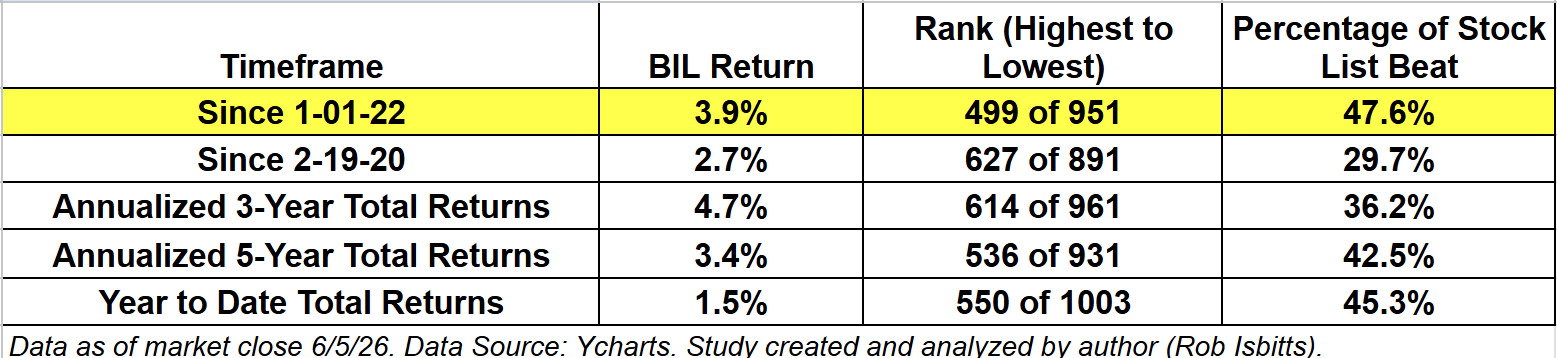
Using the Russell 1000 Index as the universe (which shrinks slightly over longer time frames in the above table, as it only includes stocks which have been in the index the full period), about half of 950 stocks have not outperformed “measly” T-bills. I used the State Street SPDR Bloomberg 1-3 Month T-Bill ETF (BIL) to represent that cash-like investment. So without using fancy stats like equity risk premium, it is fair to say that if you were not a strict index-tracker, crowding into the top names and holding them, there’s an excellent chance your portfolio has a relative “loser” to T-bill since 2022, for every relative winner.
If that doesn’t strike your brain where it hurts, you’re not paying enough attention. This market has been described as “top heavy.” But that only refers to how few stocks are carrying the load in terms of high weightings in the S&P 500 and other growth stock indexes. This is different.
Here we are talking about the decision to take on risk and invest in single stocks.
For Baby Boomers and Generation X investors who have accumulated strong stock portfolio balances, there’s never been a better time to look underneath. Just to make sure you don’t have mold in the closet. Or worse yet, asbestos, in the form of convincing yourself your portfolio is doing well as a unit.
Sure, the few can carry the many, and have for years. However, my simple question is: What happens when they don’t? The rest of the “club” that is the top 1,000 stocks have been unable to pull their weight.
And while 4% for T-bills or 5% for longer-term bonds is not sexy, not getting routed when that top-heavy market goes… shall we say… topless… might be the coolest thing investors have seen in nearly 20 years. It has been a fun ride for S&P 500 index investors. And it might very well continue. But the No. 1 priority for stock-picking investors should be creating a back-up plan.
Yes, we could have a magic “broadening” of the stock market, where the zeroes become heroes. But this data indicates there’s something else going on. And I think it is the persistently high cost of capital that higher rates bring. And now, inflation is elevated, and not likely to “GLP-1” itself back into fighting shape very soon.
The headline S&P 500 total return has officially mutated into a statistical optical illusion. If you blindly audit the performance of the broad cap-weighted averages over the last 4.5 years, you’d be forgiven for believing that traditional, buy-and-hold stock picking is alive and well. But when you step away from the flashing marquee and look at the raw data under the hood, a terrifying reality emerges: a massive, structural divergence has quietly hollowed out the equity landscape right under our noses.
When index concentration reaches this terminal phase, the market ceases to be a diversified safety net. It becomes a top-heavy momentum fund. If or when the market’s whims shift, the mega-caps will drag the rest down with them indiscriminately.
What I’m Doing About This
That study helped me think of those 1,000 stocks, which are the vast majority of U.S. market capitalization, in a few groups:
- Mega-cap tech
- Losers vs. T-bills since 2022 that will be lucky to do that well the rest of this decade (many stocks are nearing a “debt cliff”)
- Non-tech with businesses in strong shape and anti-cyclical properties
- The rest, which are mostly isolated single-stock situations
My plan: tread lightly with the first two groups. But look at the last two tactically. That’s not saying I’m looking to hold them for years and years. Instead, I plan to use the vast toolset at Barchart.com to chart them, apply some quantitative analysis, and lots of disciplined portfolio management.
Because what is lost in that summary data above is that stocks are not spending four or five years as flat pancakes. They are still volatile. That volatility is an opportunity… If you have the right level of awareness, the right resources, and the willingness to cut and run as frequently as possible to capture intermediate-term gains and avoid big losses.
Rob Isbitts created the ROAR Score, based on his 40+ years of technical analysis experience. ROAR helps DIY investors manage risk and create their own portfolios. For Rob’s written research, check out ETFYourself.com.
On the date of publication, Rob Isbitts did not have (either directly or indirectly) positions in any of the securities mentioned in this article. All information and data in this article is solely for informational purposes. For more information please view the Barchart Disclosure Policy here.
/Microsoft%20headquarters%20By%20Peter.jpeg)
/NVIDIA%20Corp%20logo%20outside%20building-by%20BING-JHEN_HONG%20via%20iStock.jpg)
/Micron%20Technology%20Inc_%20logo%20on%20building-by%20vzphotos%20vis%20iStock.jpg)
/Amazon%20-%20Image%20by%20bluestork%20via%20Shutterstock.jpg)