
Maybe it is not as adventurous as the now-iconic TV commercial about “The Most Interesting Man In The World,” but the S&P 500 Industrial Sector SPDR ETF (XLI) has historically been my favorite. Not due to past performance, since we all know tech takes that contest handily.
There is one thing about XLI that has distinguished it from the other 10 S&P 500 sectors, from Energy to Materials to Financials, Consumer Discretionary and the rest. XLI was the only one not crowded into a handful of names.
Other sectors are dominated by a few big stocks. However, XLI looked more like an equal-weighted basket. That has made it a prime area to shop for single stocks.
XLI was one of the very first ETFs issued, way back in 1998, and has now grown to over $31 billion in assets. It sells at 25x trailing earnings, which is not cheap.
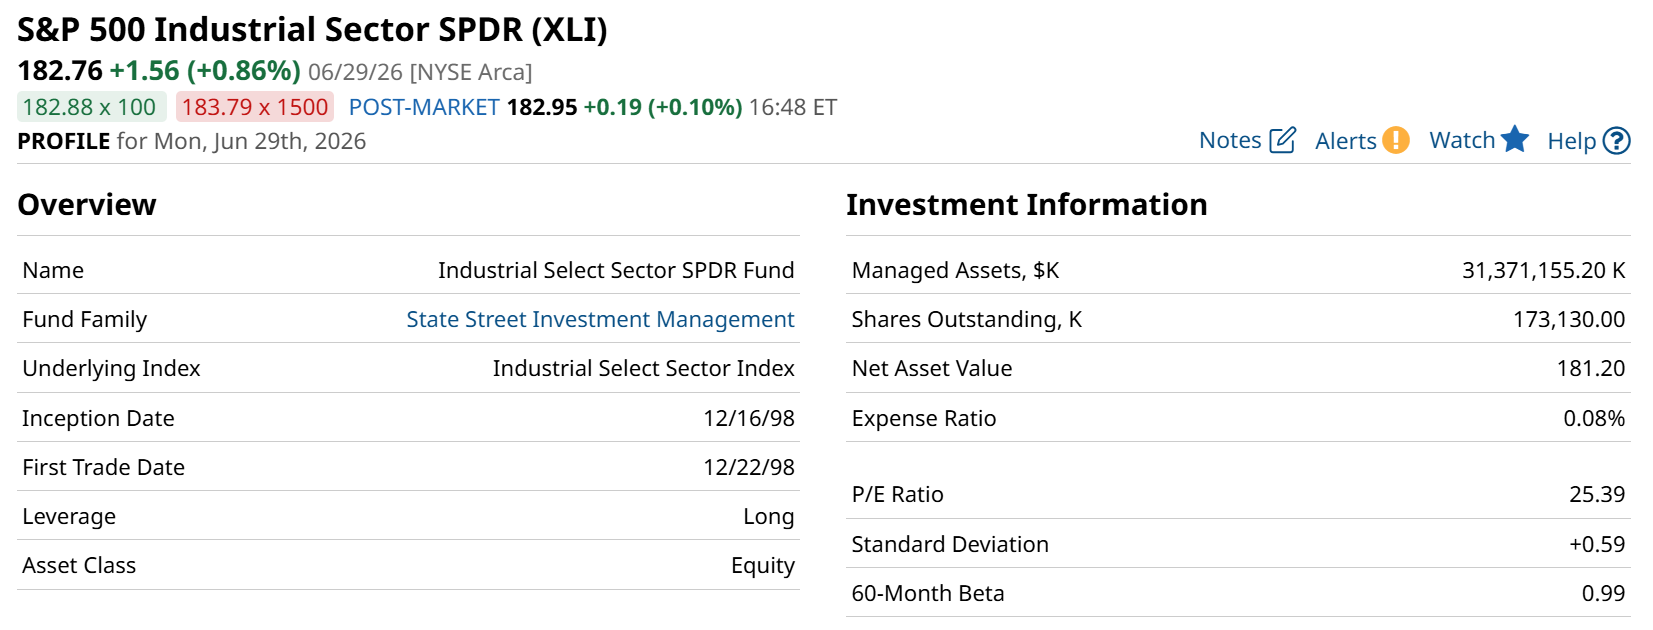
That’s not my biggest concern, however.
Of its more than 80 holdings, just 10 comprise 41% assets. Even more concerning is how those top three stocks have broken away from the pack.
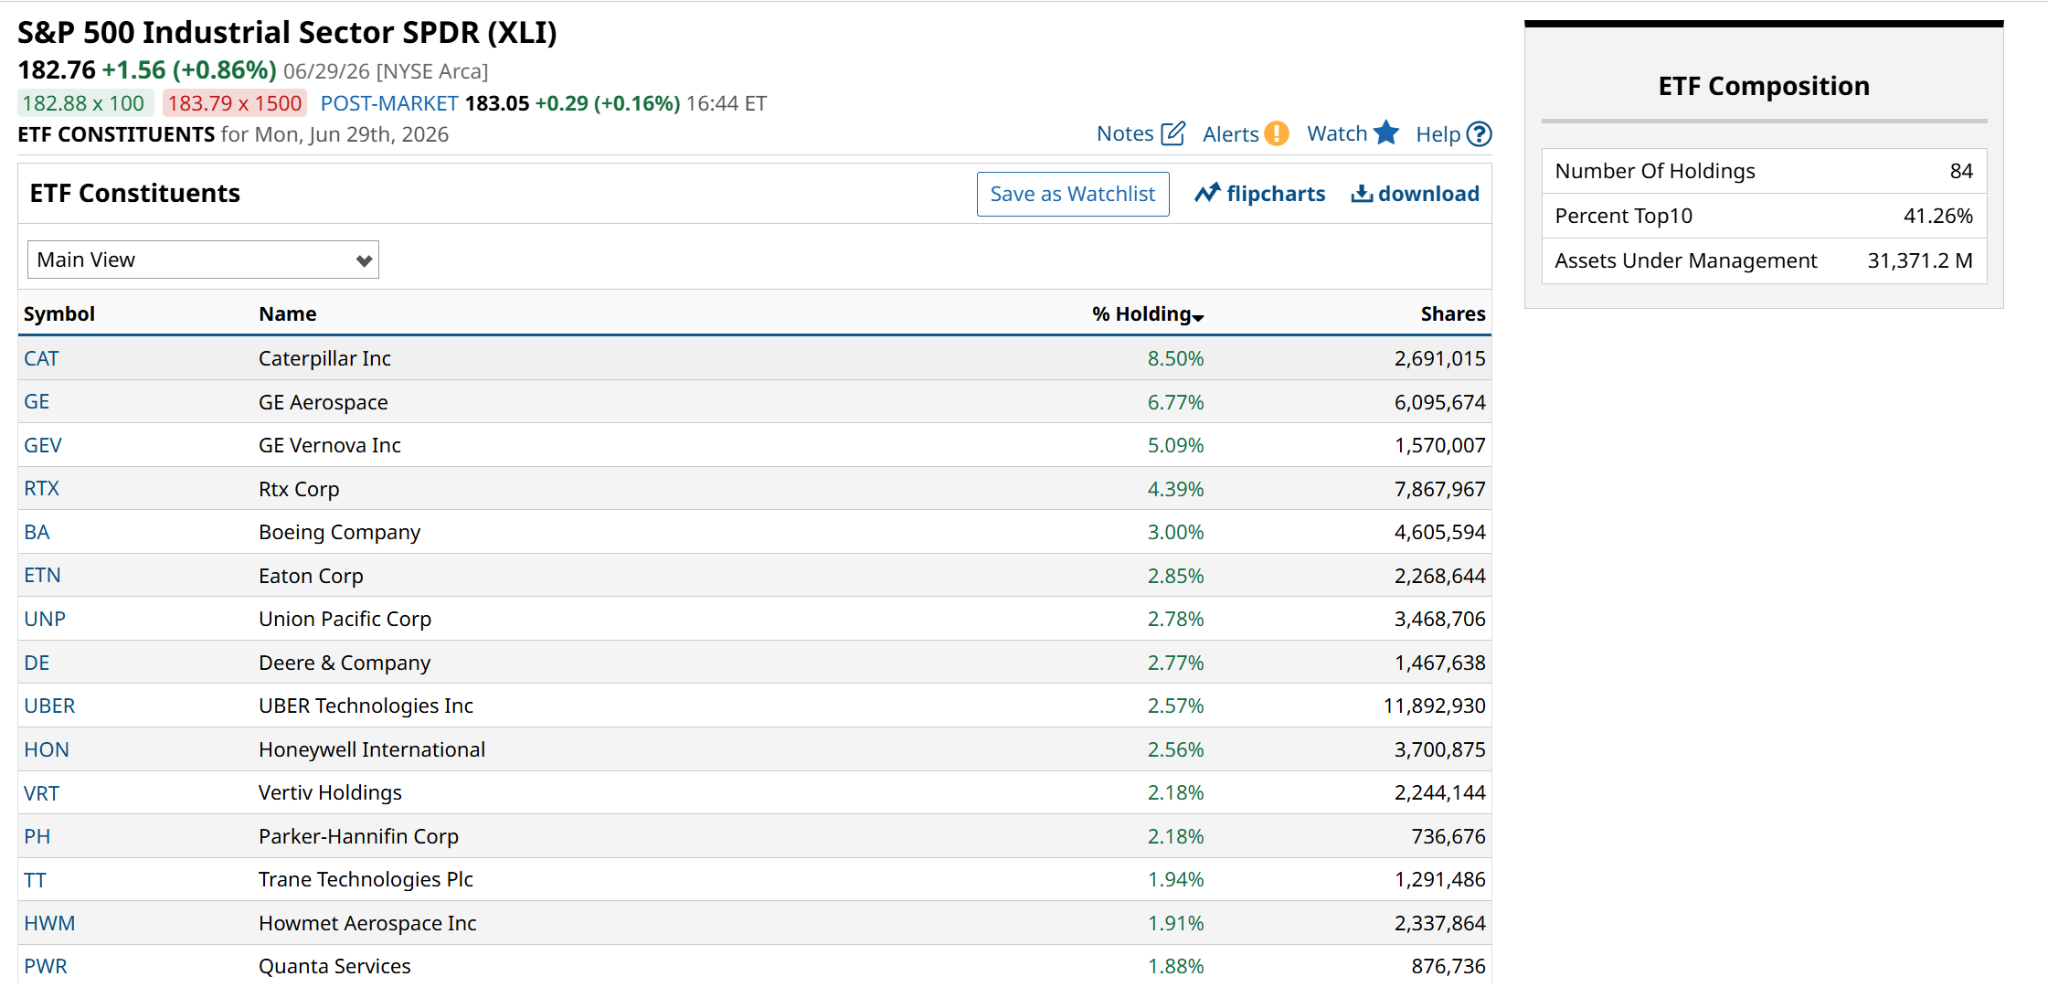
Those top three now account for more than 20% of fund assets. That’s not extreme, but it is making me think that even this last holdout is turning into a case of crowding at the top.
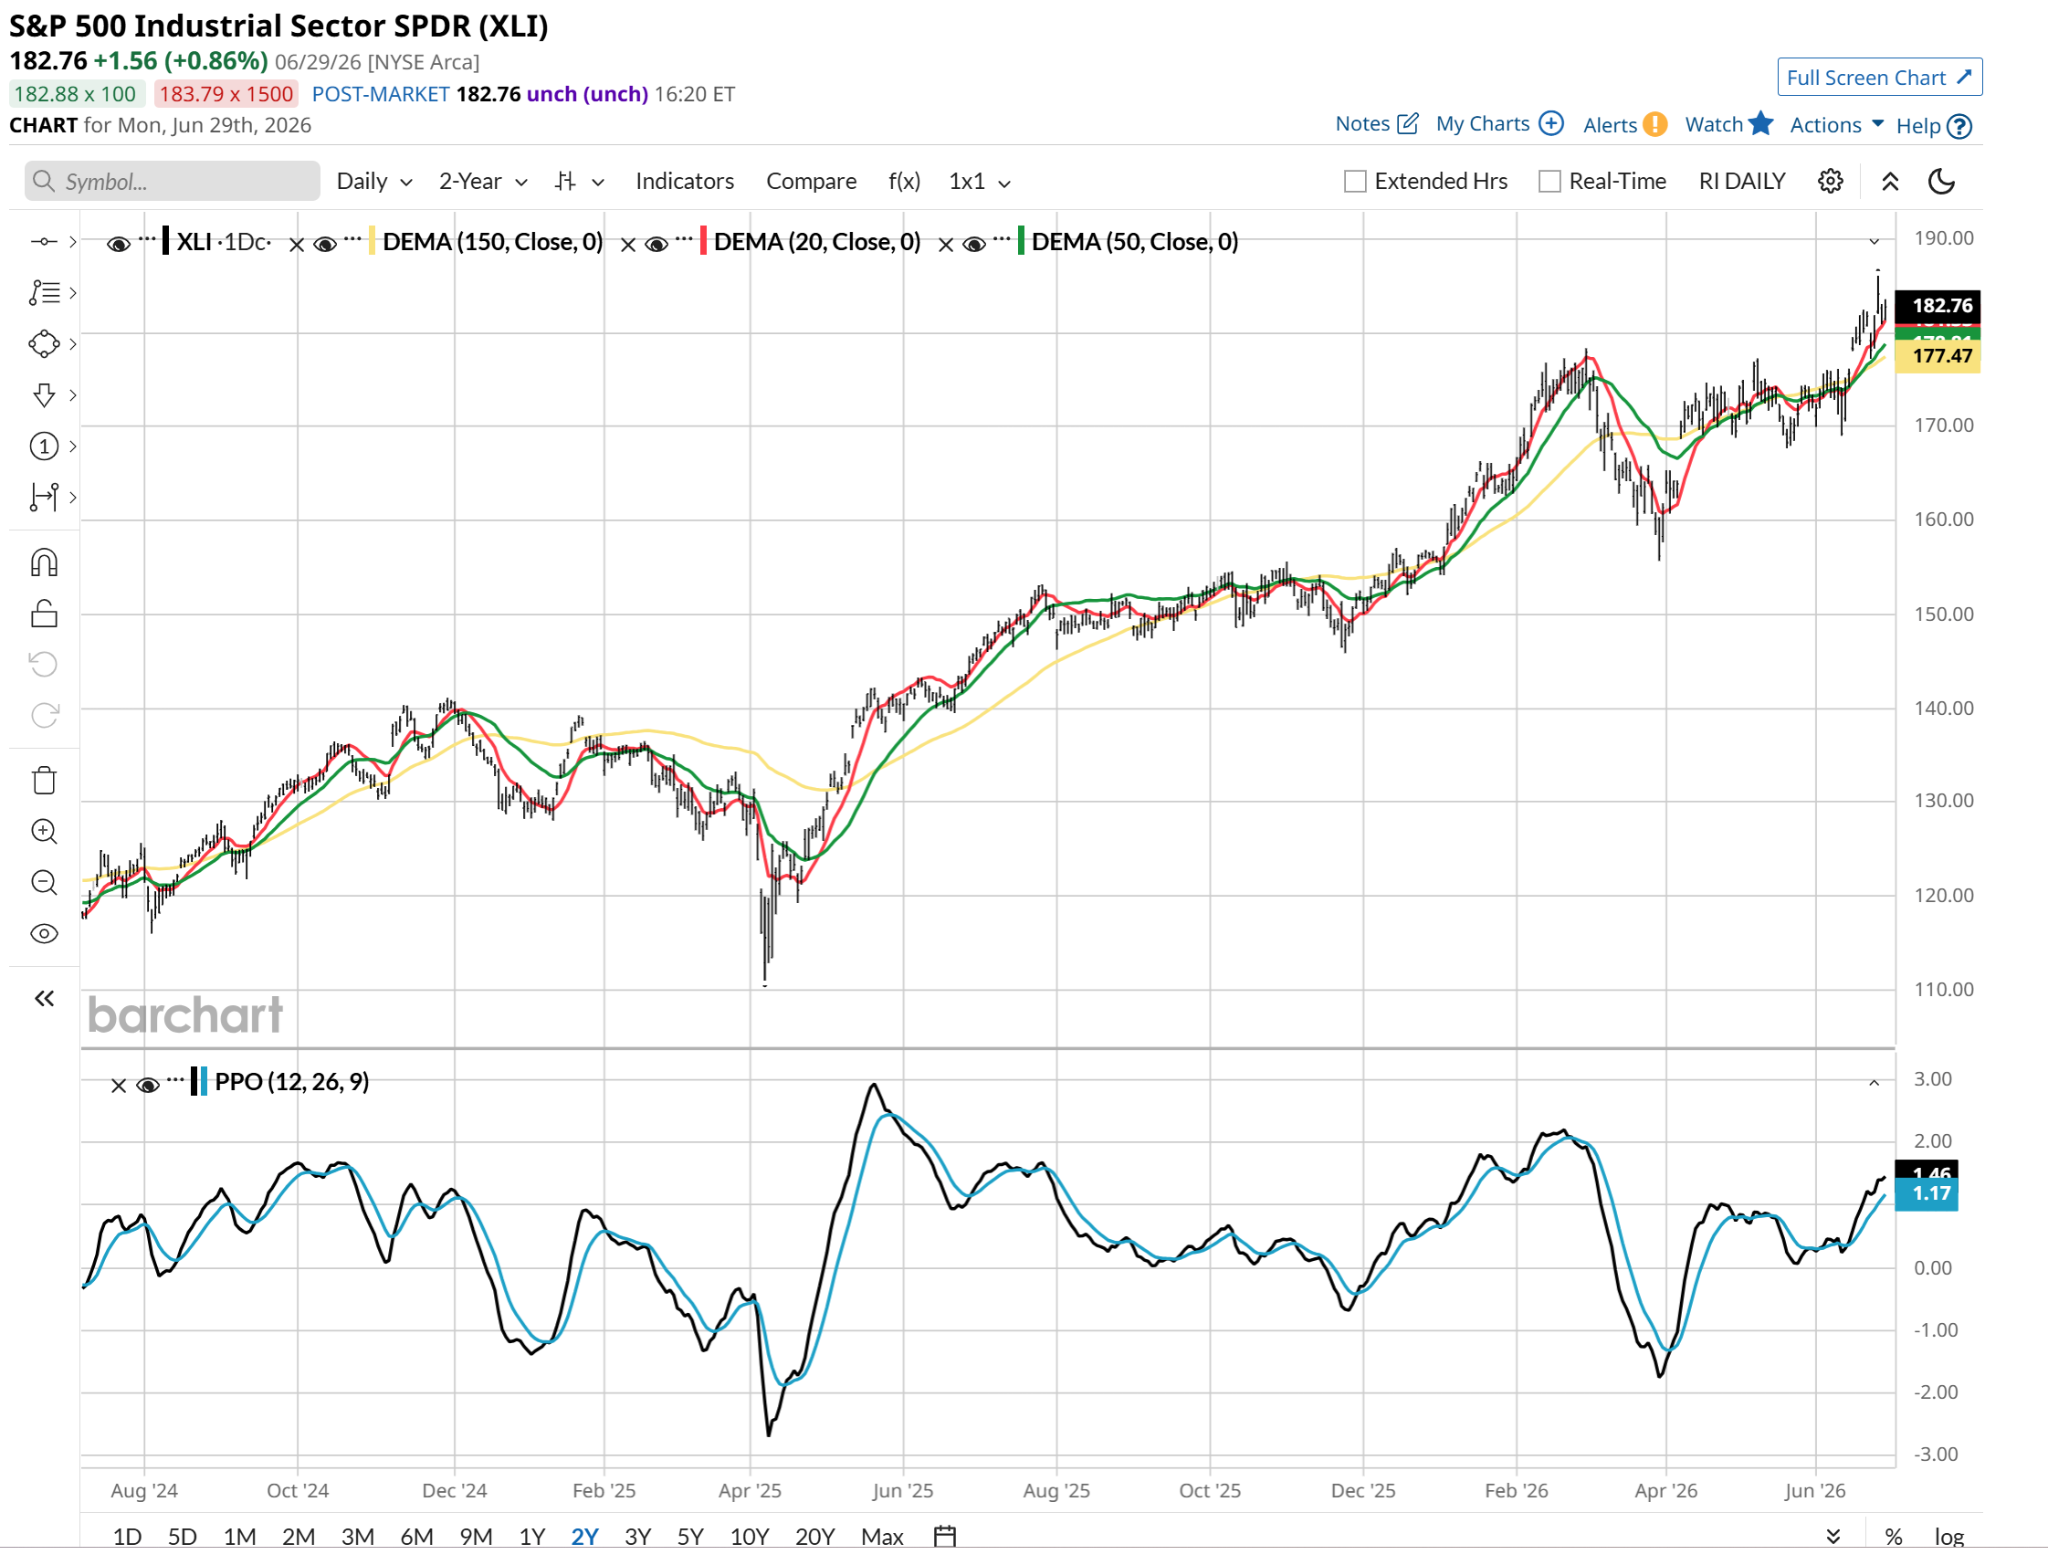
But that also means we can get a good idea of where this sector might be going by charting those leaders. The daily chart for the ETF overall looks “meh,” to use a non-technical word. Nothing special, and not particularly dangerous. At least on a relative basis to the S&P 500 Index ($SPX).
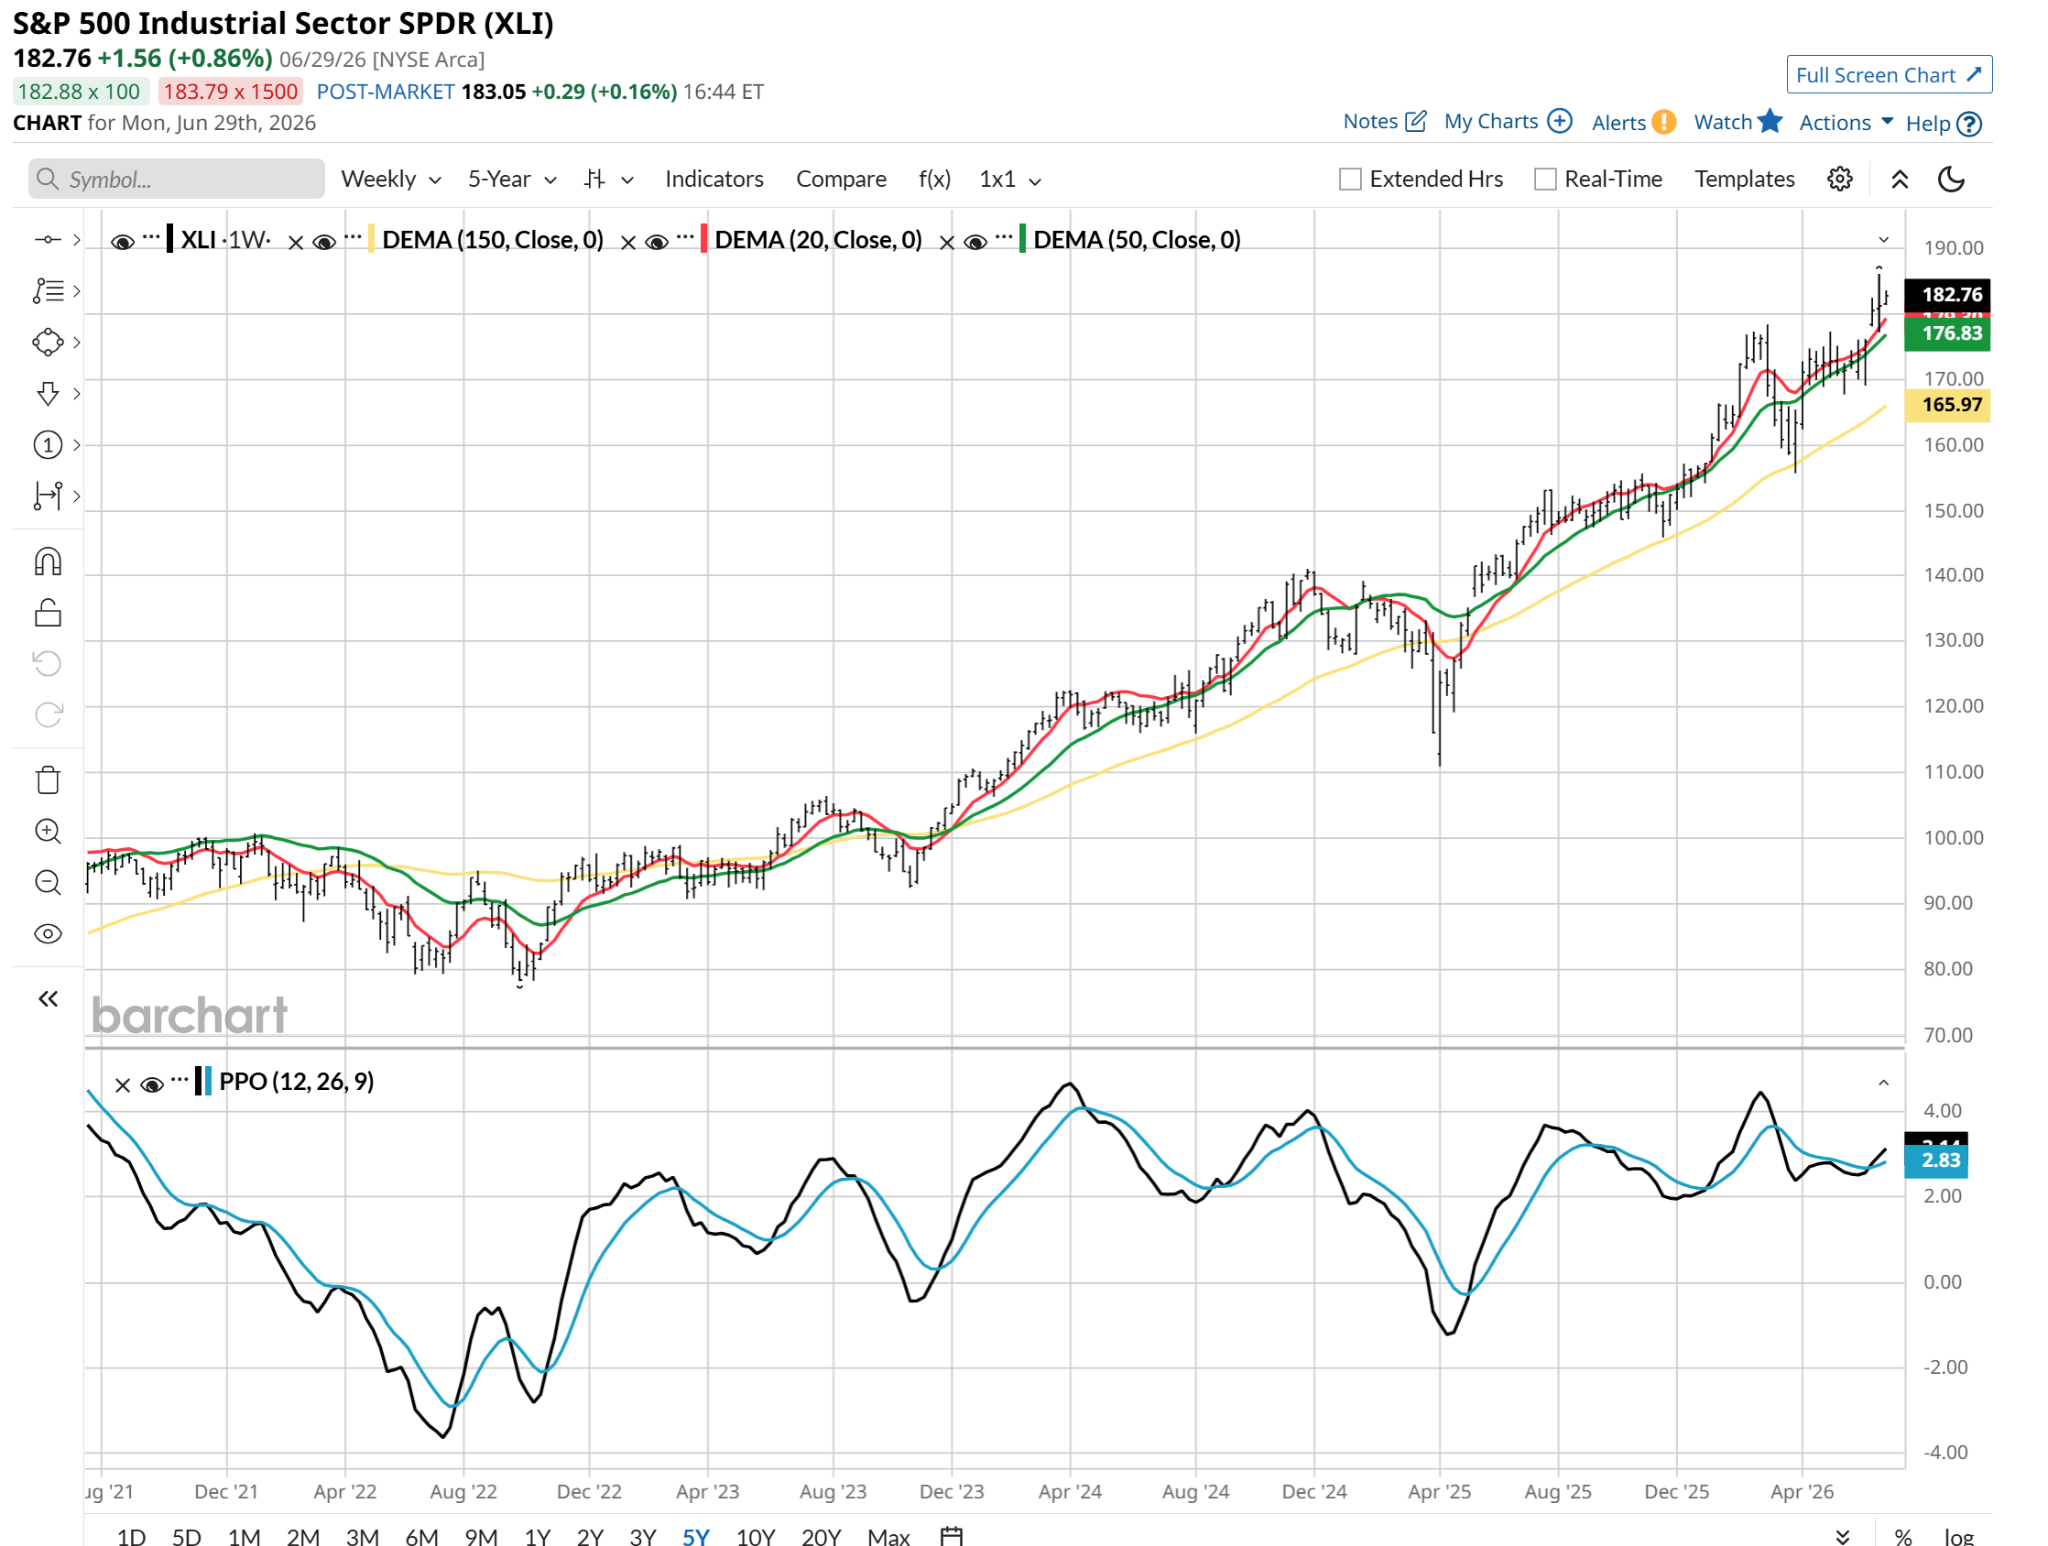
The weekly chart below tells a story of a long, steady ascent, which shows no clear signs of cracking just yet. Again, we’ll look at the leaders to double-check that.
Before we do, let’s examine the current narratives in this diverse set of industrial stocks. These are competing for attention with AI and energy stocks, which have stolen the headlines this year. Traditional, real-world businesses like heavy manufacturing, aerospace, and logistics were largely treated as dead money, ignored by the momentum crowd. And since industrials are only 8% of the S&P 500 Index, and less than 3% of the Nasdaq-100 Index ($IUXX), the sector is not exactly buzzy.
So, what’s going on within XLI that might pique investor and trader interest?
First, recent manufacturing data showed that orders for manufactured durable goods rose more than 9% year over year. This acceleration means that domestic capital expenditure is actively expanding, led by fabricated metals and infrastructure inputs.
Second, global fragmentation and supply chain lessons from tariffs, the Strait of Hormuz disruption, and other factors have forced big corporate buyers to aggressively reinforce domestic manufacturing strength. The long-term capital buildout for manufacturing plants is finally turning into realized revenue for heavy machinery and engineering firms.
While the bears have spent the year forecasting an immediate recession, the final revision for Q1 GDP clocked in at a resilient 2.1% annual rate, powered explicitly by durable goods manufacturing and private goods-producing industries. This could change once the intermediate term impacts of the Iran War become more visible. I interpret that from the chart patterns shown above, in that they are OK, but lack the look of powerful follow-through to the upside.
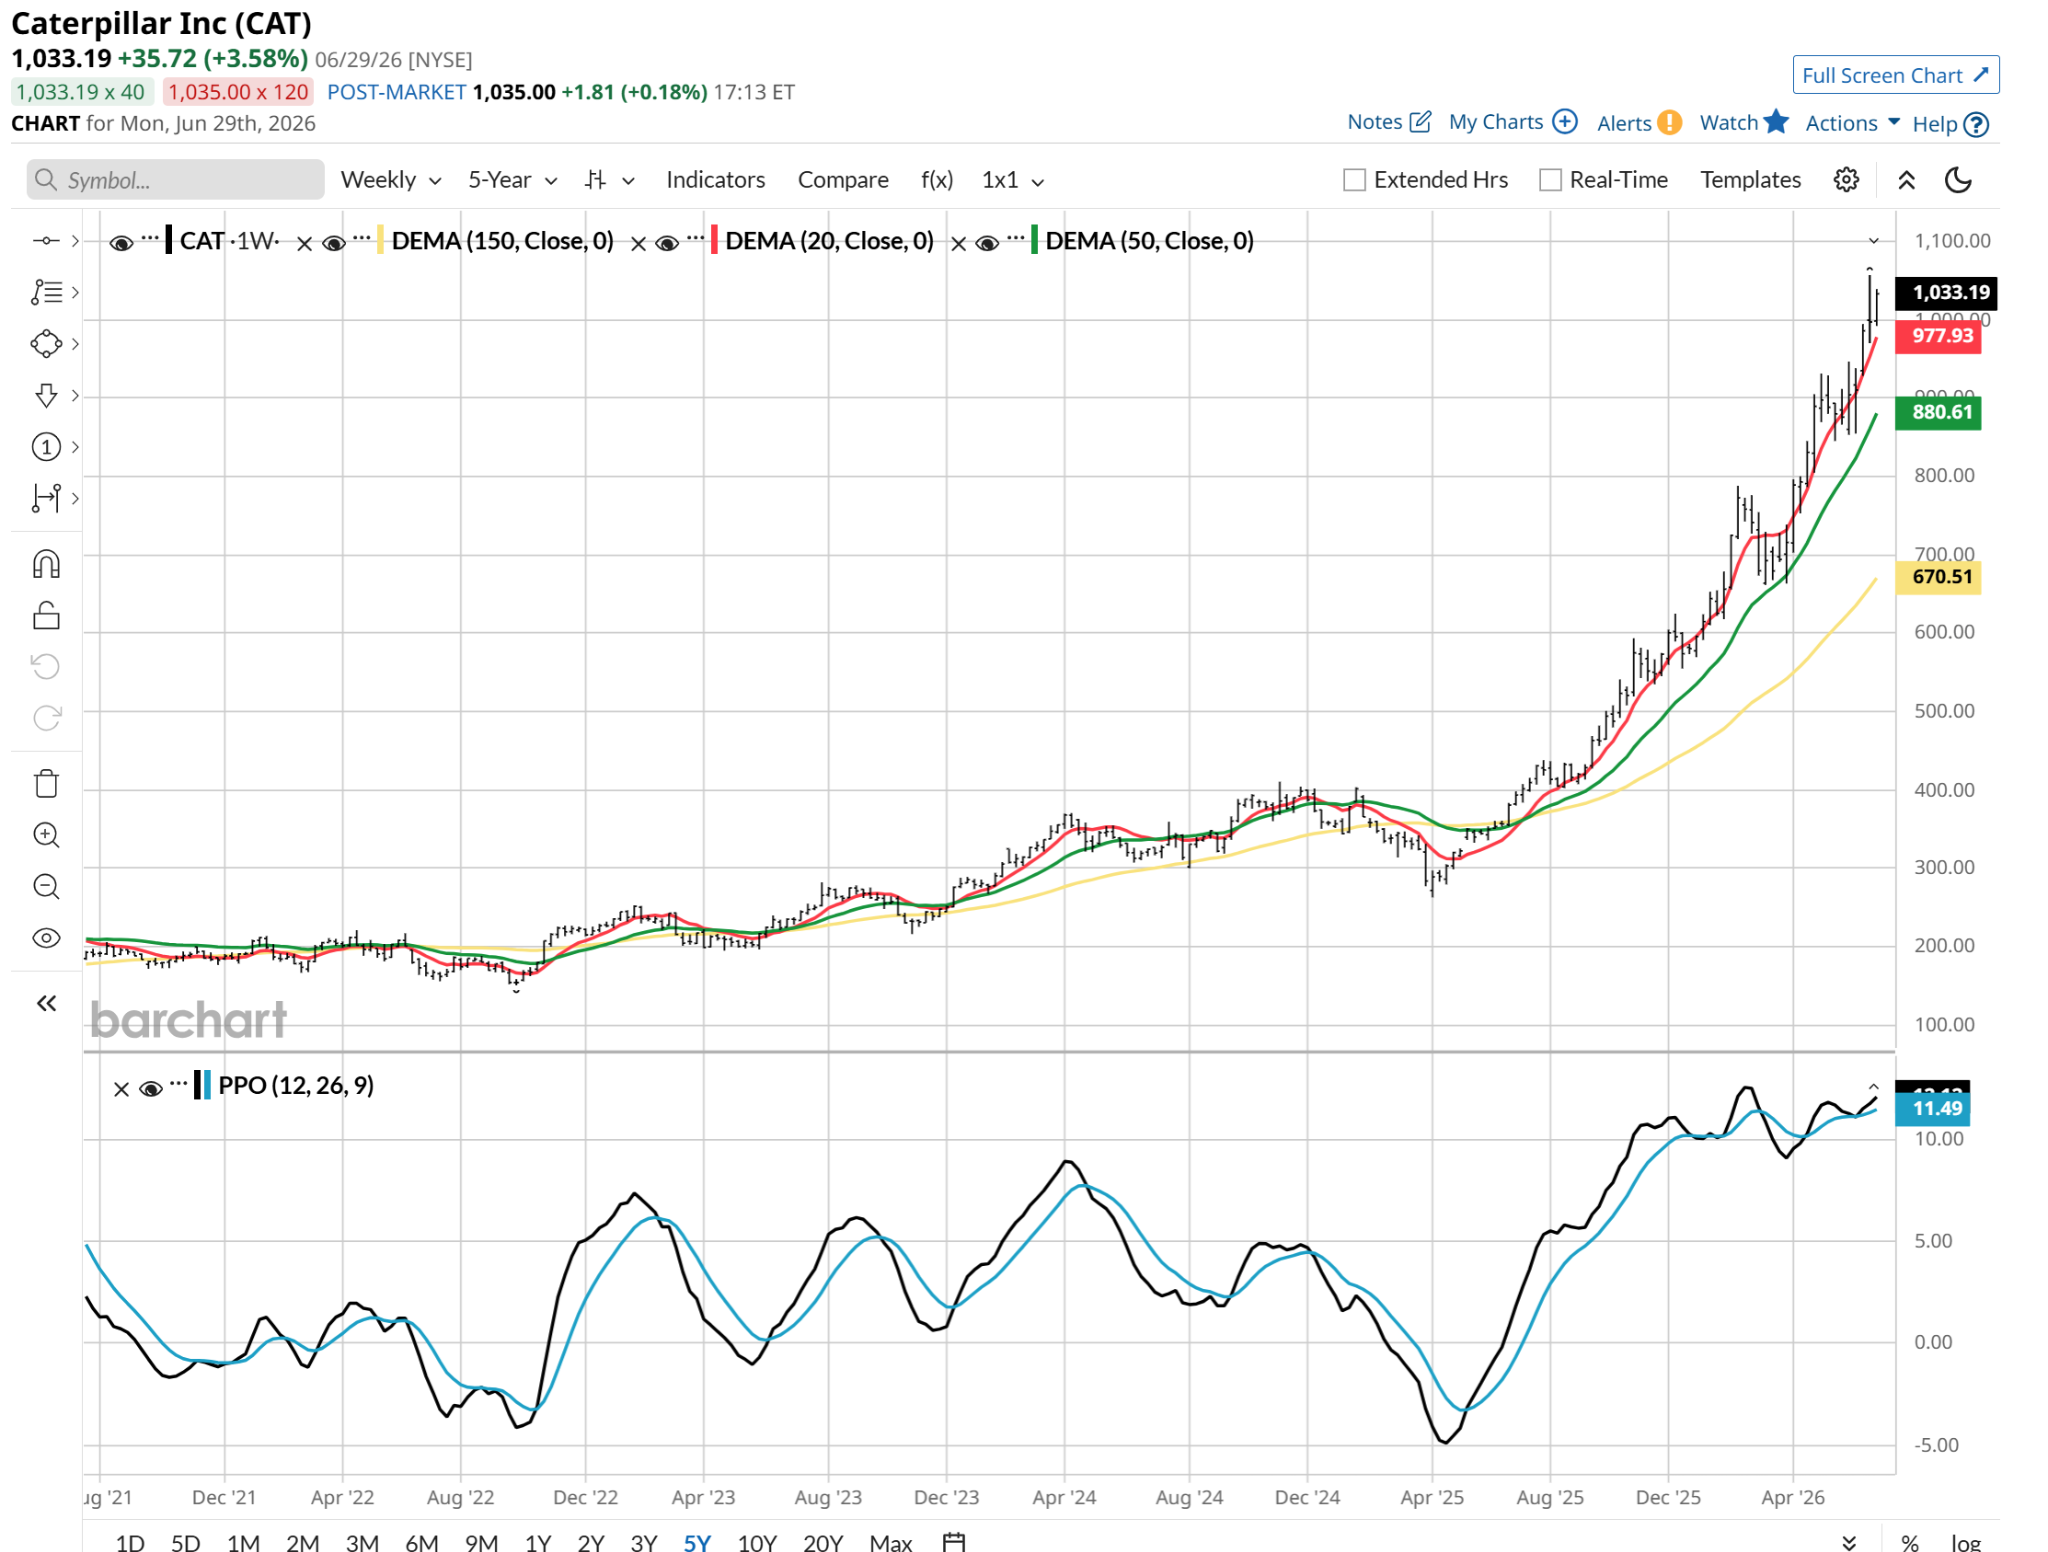
Now to those charts of the “big three” stocks which make up more than 20% of XLI. Remember, this sector did not have a trio like that for a long time. But the price appreciation in Caterpillar (CAT), GE Aerospace (GE), and GE Vernova (GEV) has created such an oligarchy.
Caterpillar (CAT)
This is what a hold looks like to me. Too far gone to chase it, but no strong “sell” indicator.
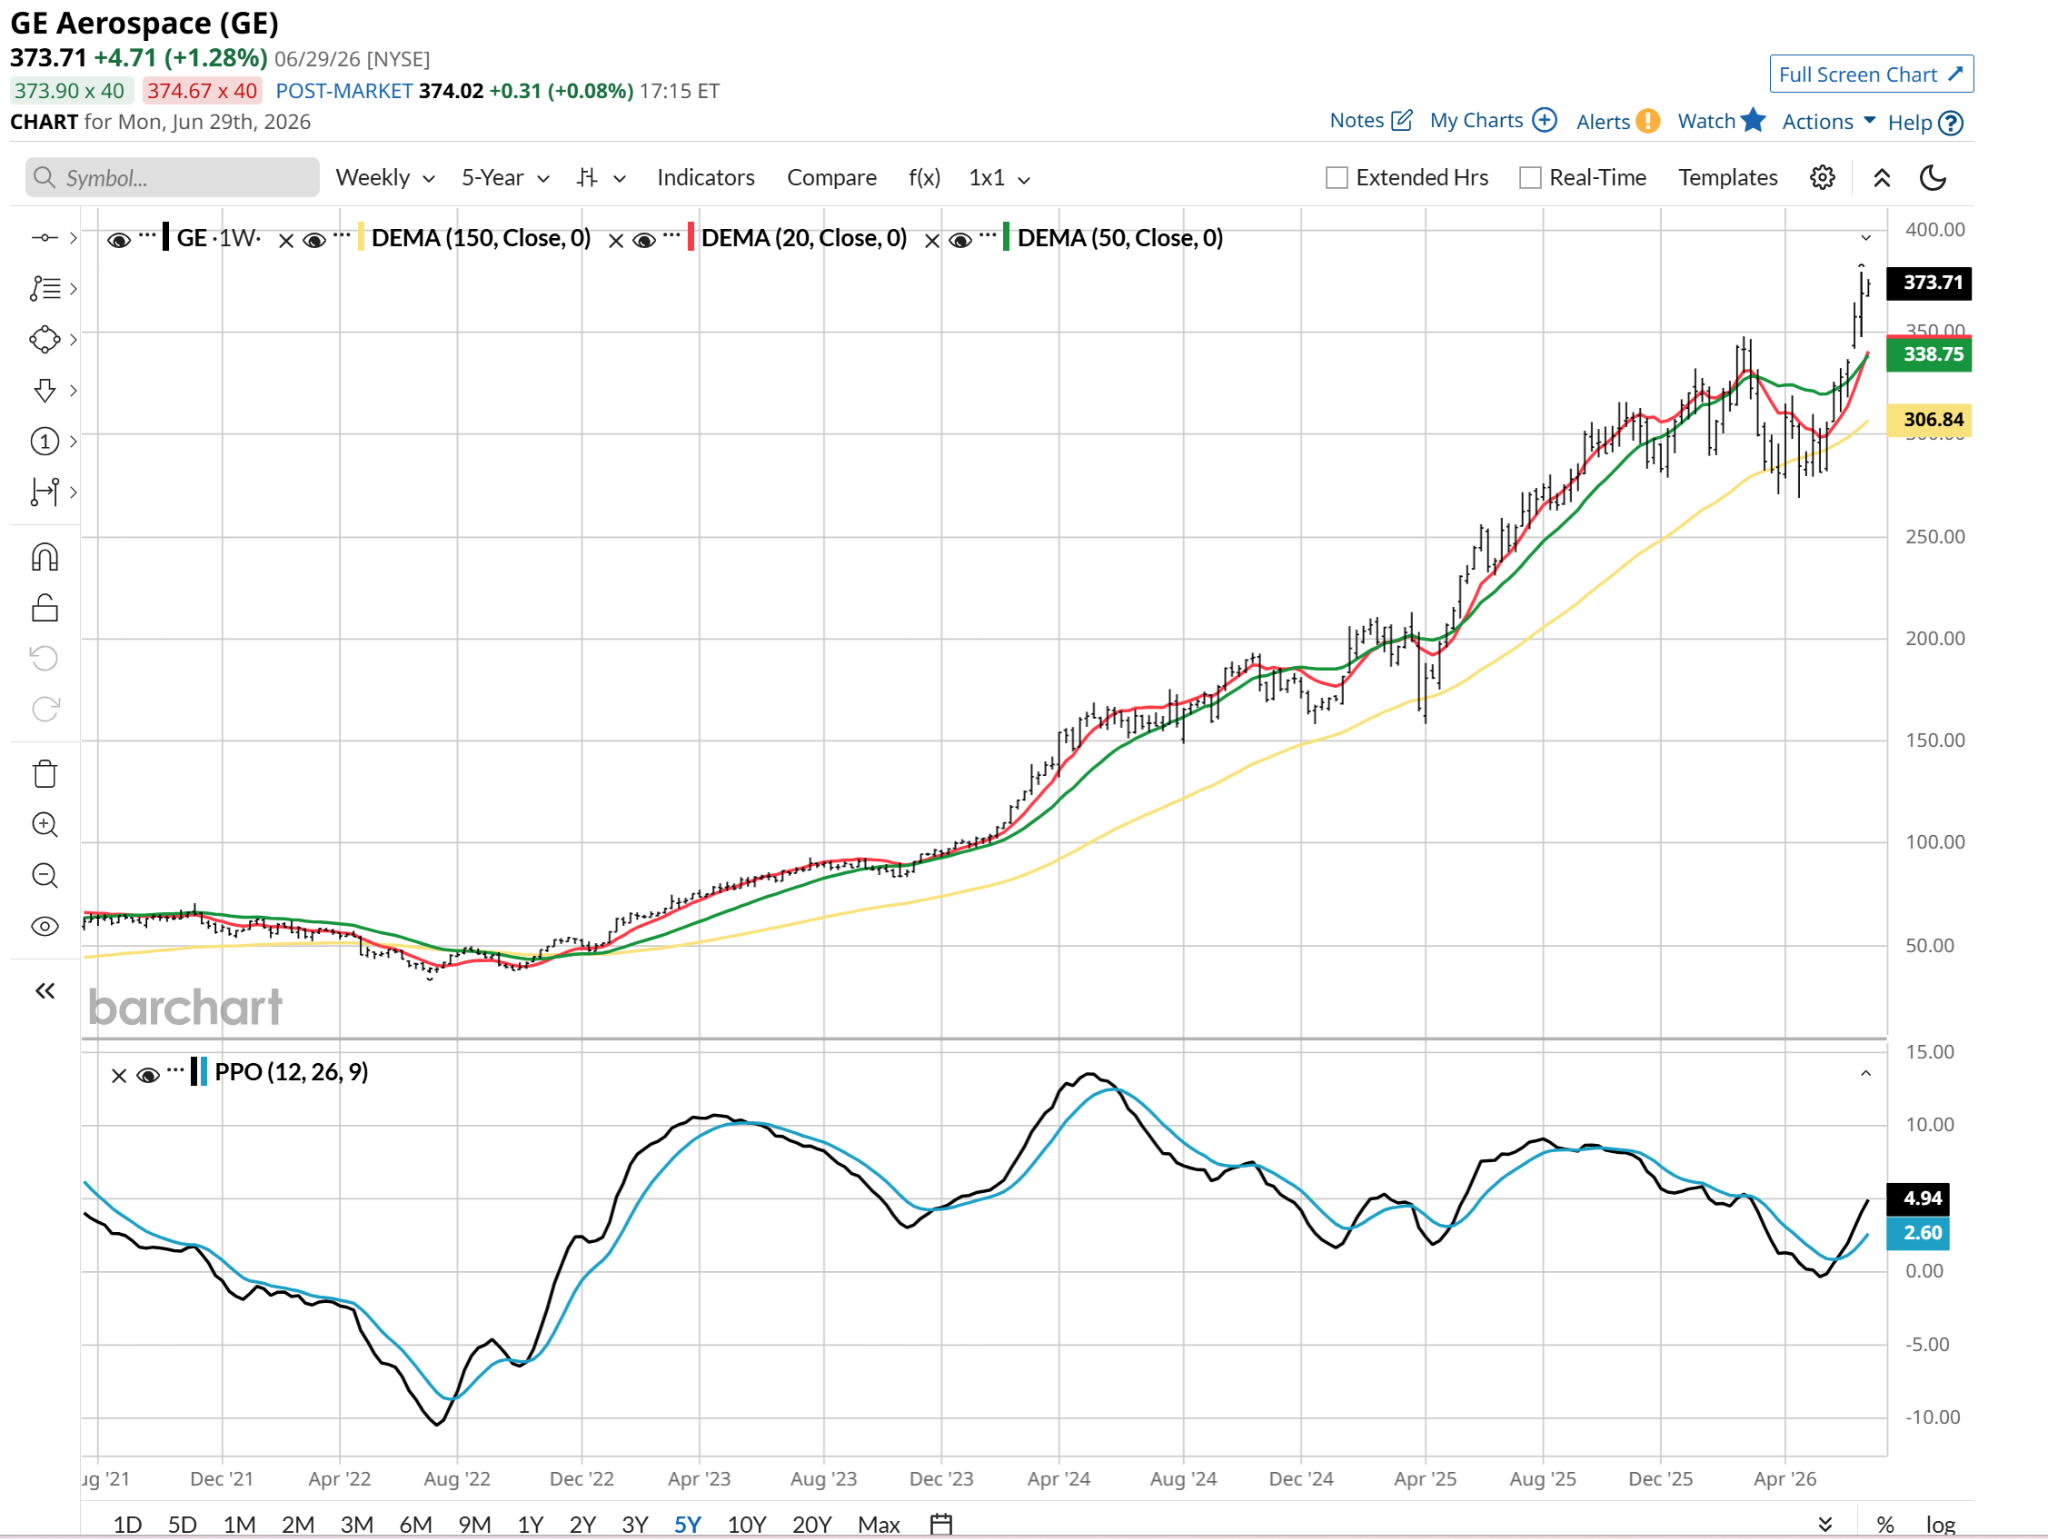
GE Aerospace (GE)
This is a different type of “hold” to me. One in which the percentage price oscillator (PPO) is showing signs of accelerating, but it is already well above the zero mark that tends to signal “risk on.” It is 10% above its high set earlier this year, so be careful if you own it.
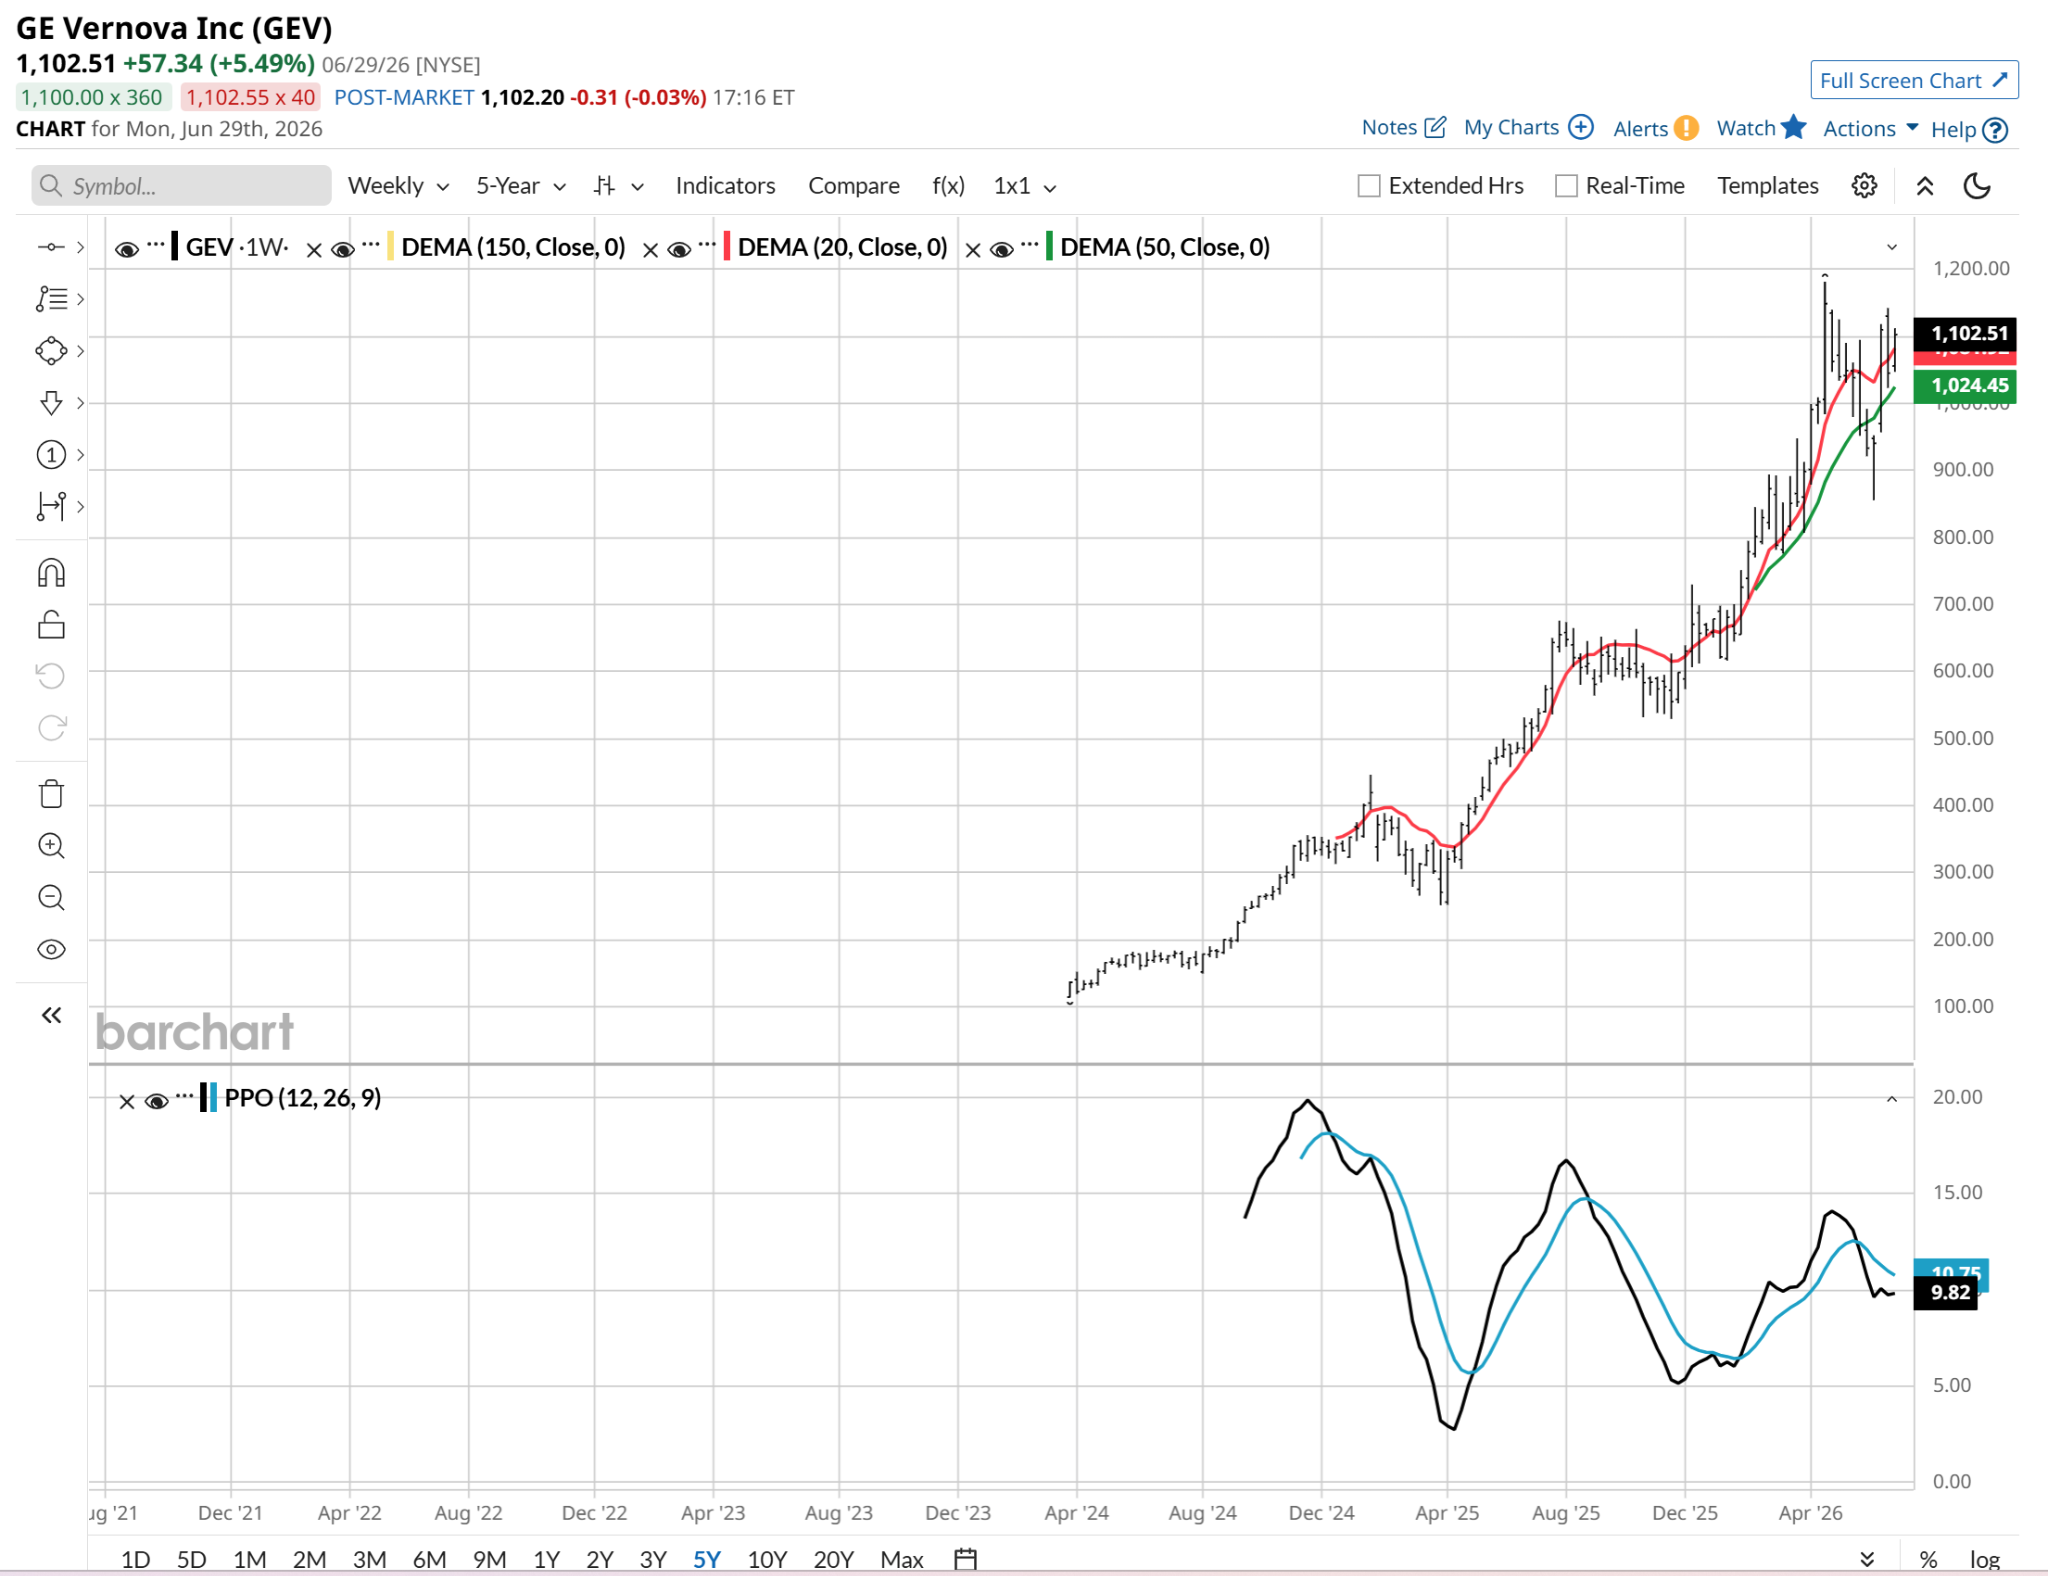
GE Vernova (GEV)
GEV has doubled since late last year, remarkable for a company that was just $140 billion market cap at that time. At 70x forward earnings, it slides into that same “careful if you own it, don’t chase it” mantra for a conservative investor like me.
FYI, as I used weekly charts, I’ll note that GEV has the best daily chart of the three to me.
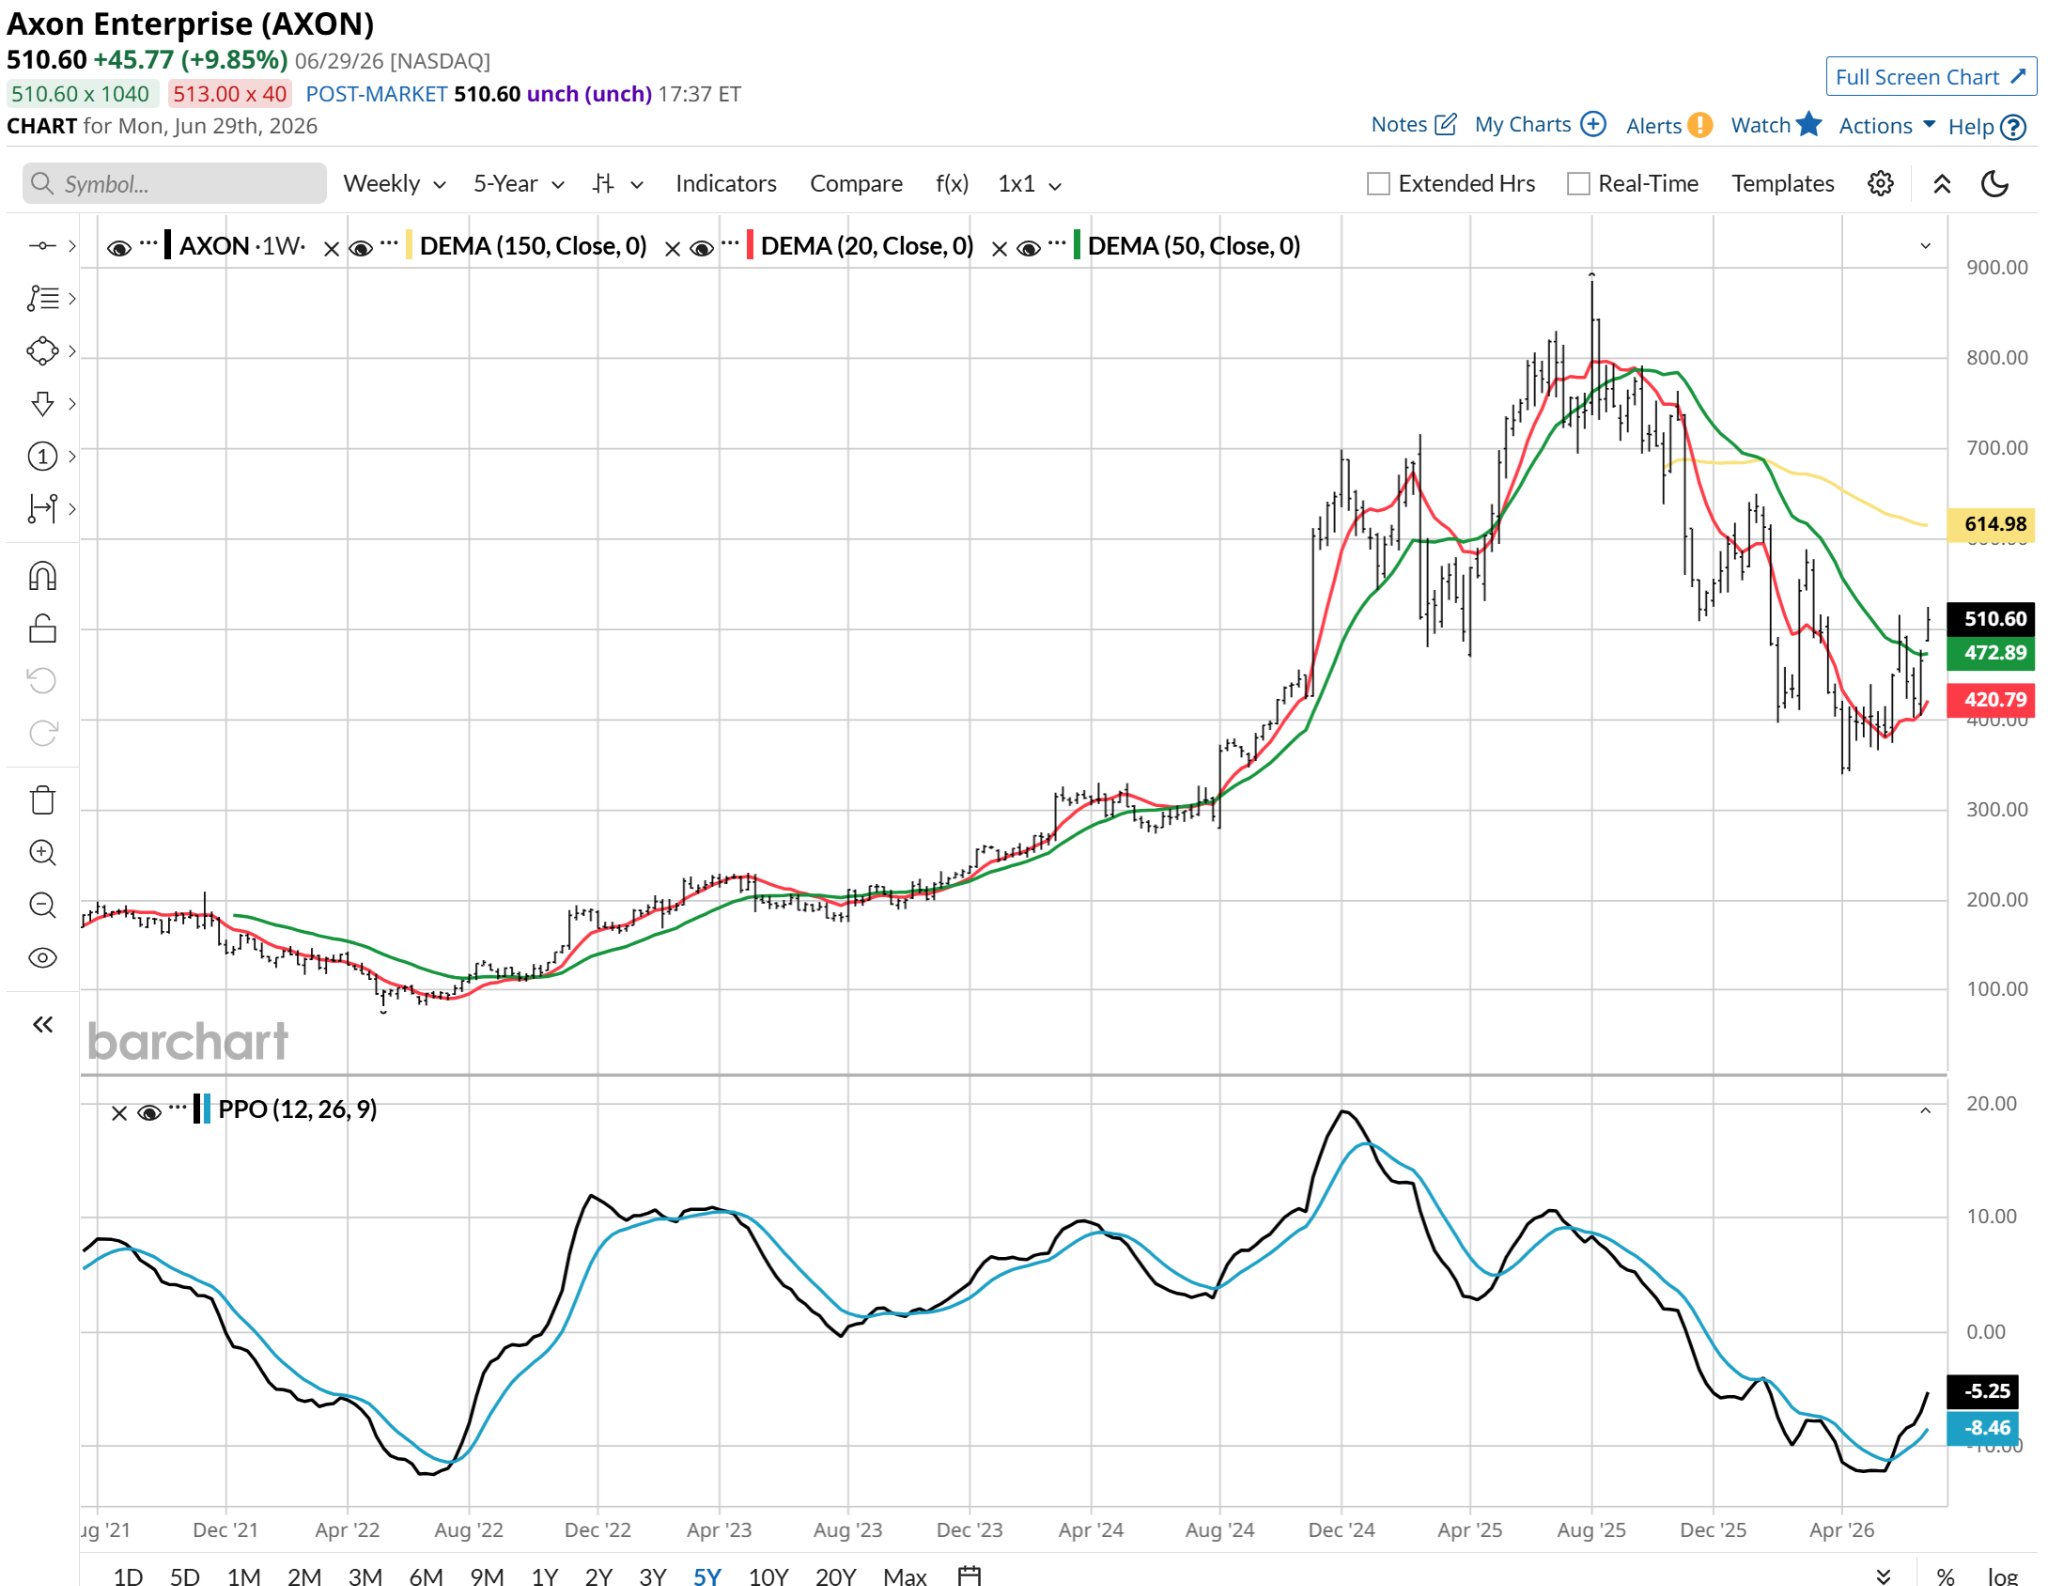
Since we went 0 for 3 there, I scanned the rest of XLI’s holdings to see if I could find a couple of up-and-coming stocks. I found these.
This breakout in Axon (AXON) has a chance to stick. It’s in the counter-drone business, and that’s likely to be in increasing demand.
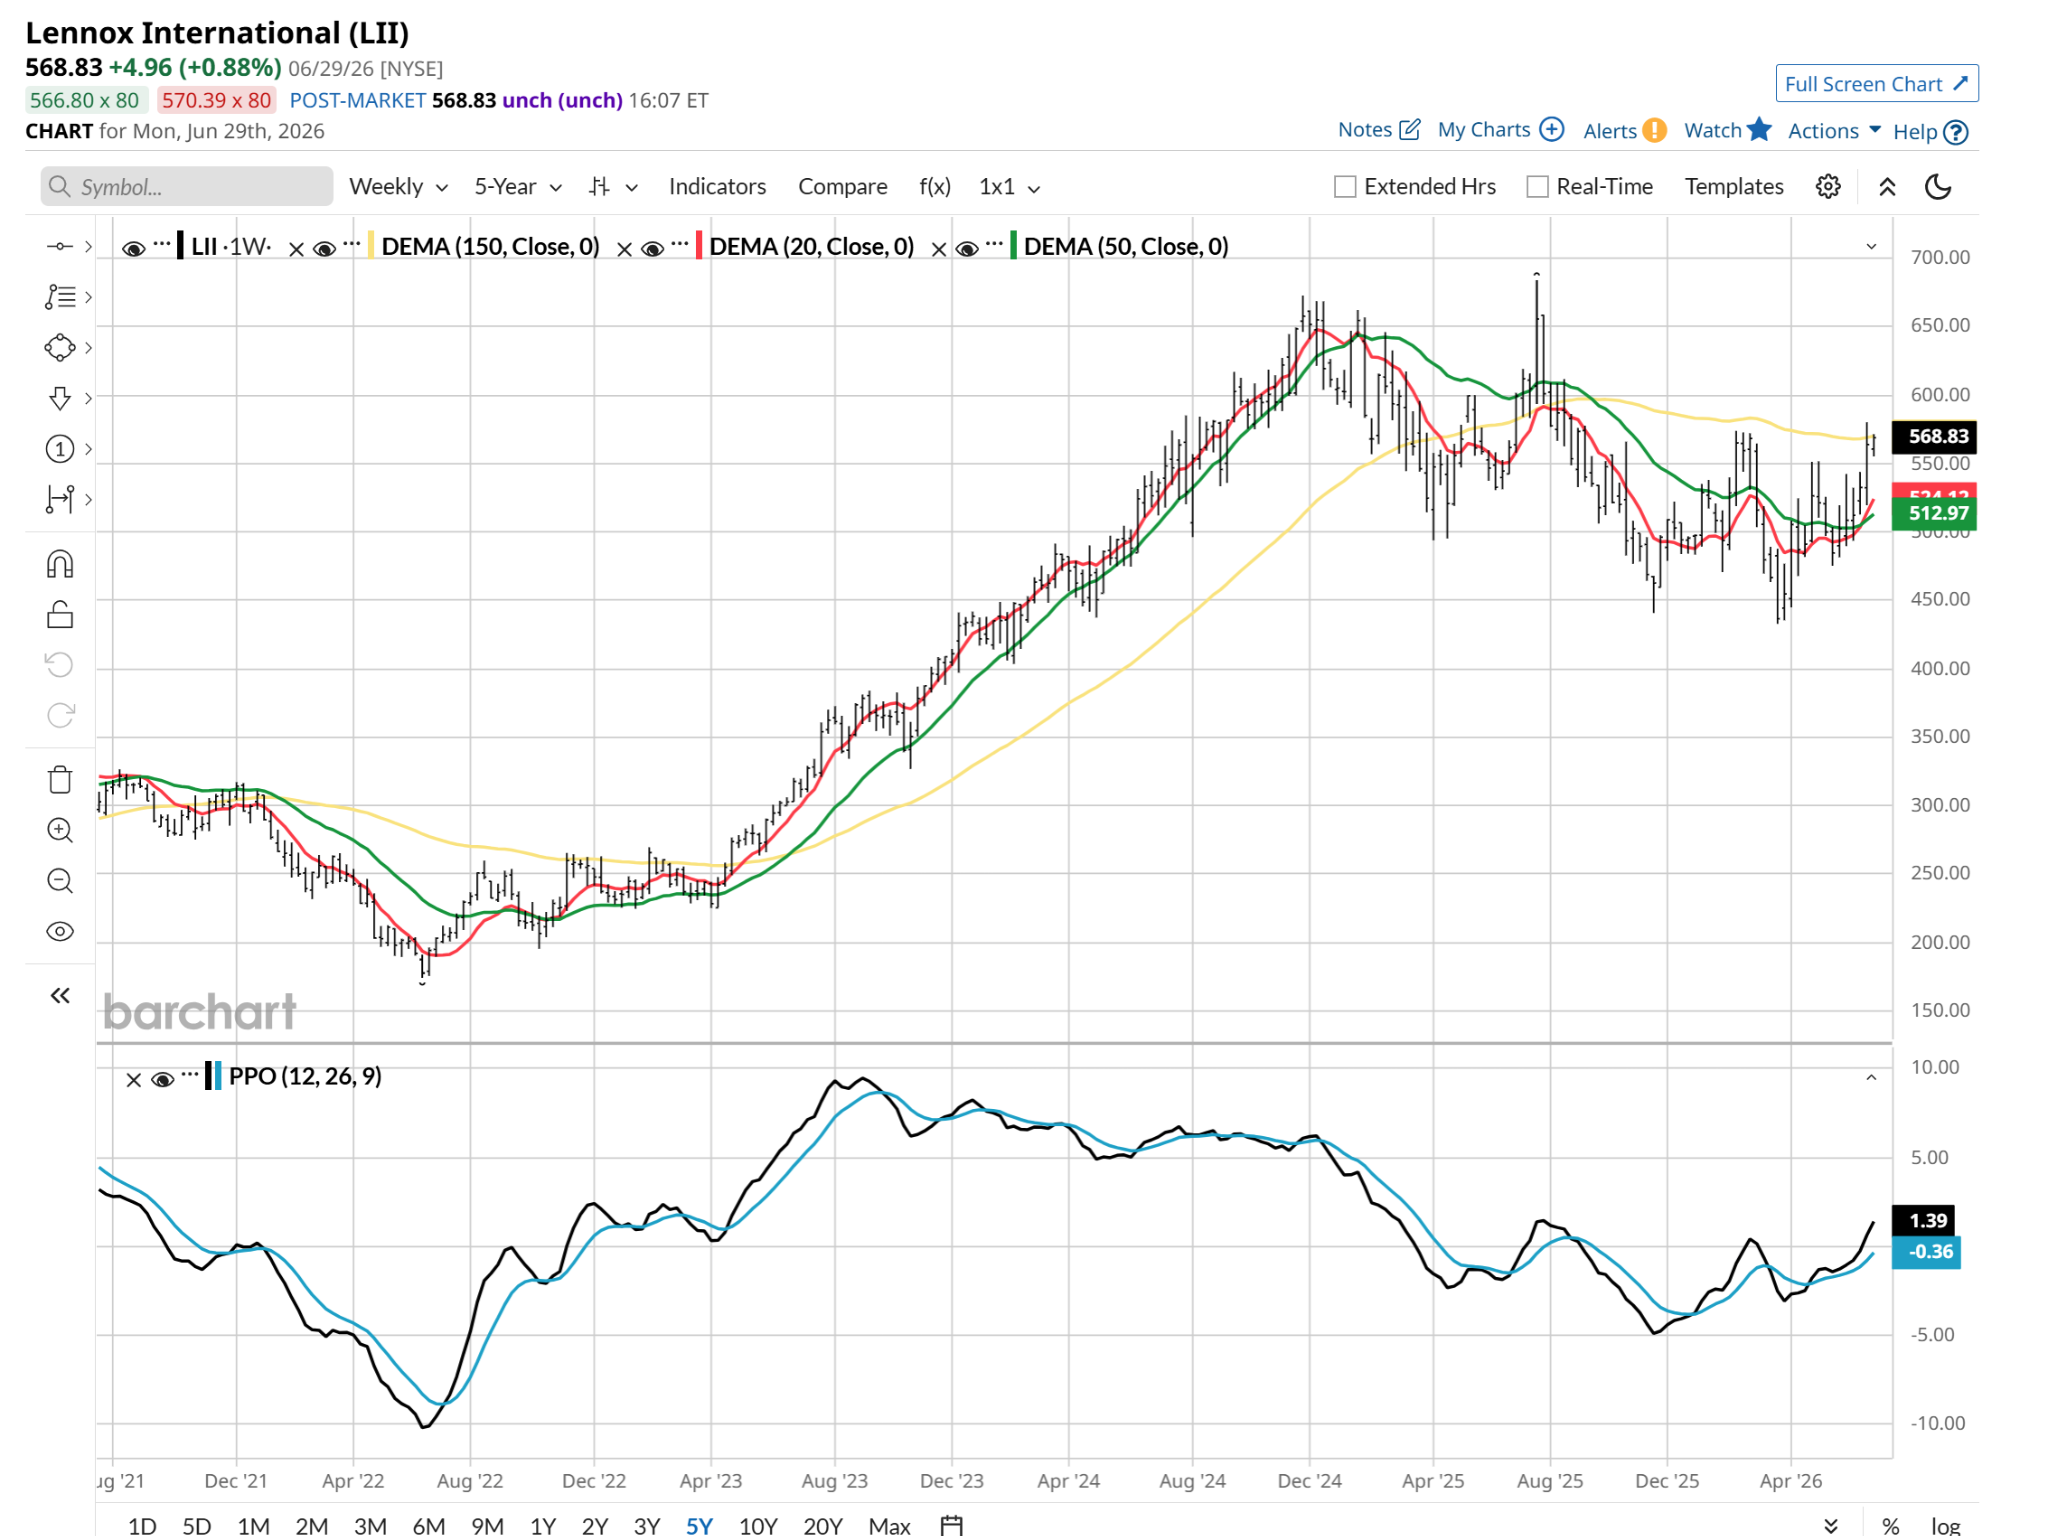
And, in an indication that XLI is a diverse group of businesses, here’s an encouraging chart from Lennox International (LII). It is in the air conditioning and refrigeration businesses. Just in time for summer.
We can learn a lot about a sector by checking under the hood of an ETF that tracks it. In cases like that of XLI, some of the parts look better than the whole to me right now.
Rob Isbitts created the ROAR Score, based on his 40+ years of technical analysis experience. ROAR helps DIY investors manage risk and create their own portfolios. For Rob’s written research, check out ETFYourself.com.
On the date of publication, Rob Isbitts did not have (either directly or indirectly) positions in any of the securities mentioned in this article. All information and data in this article is solely for informational purposes. For more information please view the Barchart Disclosure Policy here.
/Nvidia%20logo%20by%20Konstantin%20Savusia%20via%20Shutterstock.jpg)

/A%20game%20controller%20in%20front%20of%20a%20Roblox%20computer%20screen%20by%20Miguel%20Lagoa%20via%20Shutterstock.jpg)
/A%20photo%20of%20a%20Sandisk%20Solid%20State%20Drive%20by%20Top%20Popular%20Vector%20by%20Shutterstock.jpg)
