/Lennar%20Corp_%20phone%20and%20webpage%20by-%20Wirestock%20Creators%20via%20Shutterstock.jpg)
Miami, Florida-based Lennar Corporation (LEN) constructs and sells single-family attached and detached homes and buys and sells residential land. Valued at $20.3 billion by market cap, the company also provides mortgage financing, title insurance, commercial real estate, investment management, and other financial services.
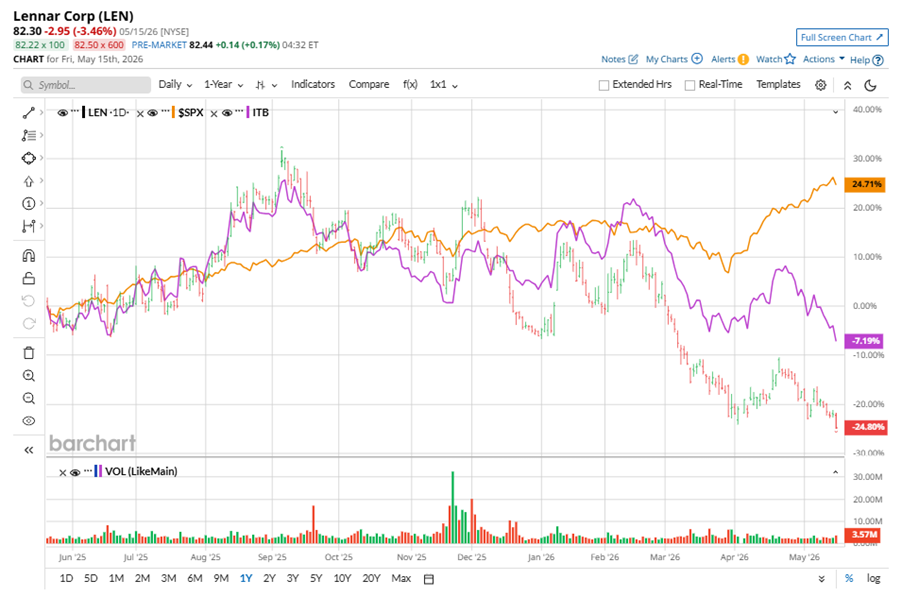
Shares of this leading homebuilder have underperformed the broader market over the past year. LEN has declined 25.3% over this time frame, while the broader S&P 500 Index ($SPX) has rallied nearly 25.2%. In 2026, LEN stock is down 19.9%, compared to the SPX’s 8.2% rise on a YTD basis.
Narrowing the focus, LEN’s underperformance is also apparent compared to iShares U.S. Home Construction ETF (ITB). The exchange-traded fund has declined about 8.1% over the past year. Moreover, the ETF’s 10.2% losses on a YTD basis outshine the stock’s dip over the same time frame.
On Mar. 12, LEN shares closed down more than 4% after reporting its Q1 results. Its adjusted EPS of $0.88 fell short of Wall Street expectations of $0.96. The company’s revenue was $6.6 billion, falling short of Wall Street forecasts of $6.8 billion.
For the current fiscal year, ending in November, analysts expect LEN’s EPS to decline 27.2% to $5.87 on a diluted basis. The company’s earnings surprise history is disappointing. It missed the consensus estimate in each of the last four quarters.
Among the 20 analysts covering LEN stock, the consensus is a “Moderate Sell.” That’s based on one “Strong Buy” rating, 11 “Holds,” one “Moderate Sell,” and seven “Strong Sells.”
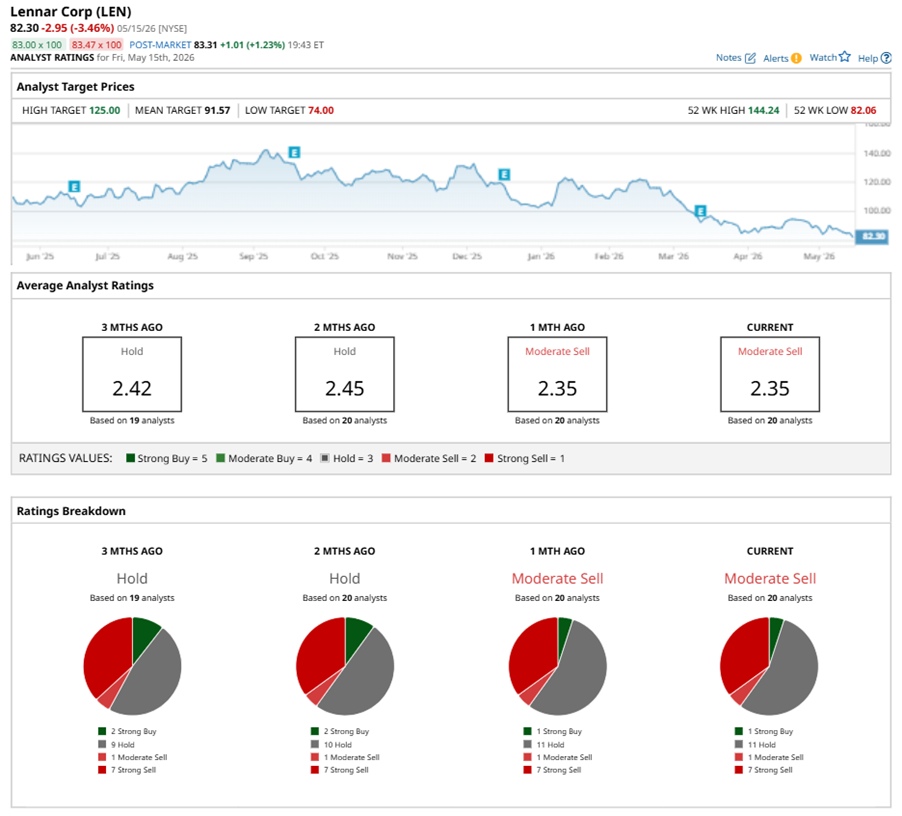
This configuration is more bearish than two months ago, with an overall “Hold” rating, consisting two analysts suggesting a “Strong Buy.”
On Apr. 20, Rafe Jadrosich from Bank of America Corporation (BAC) reiterated a “Sell” rating on LEN, with a price target of $88, implying a potential upside of 6.9% from current levels.
The mean price target of $91.57 represents an 11.3% premium to LEN’s current price levels. The Street-high price target of $125 suggests a notable upside potential of 51.9%.
On the date of publication, Neha Panjwani did not have (either directly or indirectly) positions in any of the securities mentioned in this article. All information and data in this article is solely for informational purposes. For more information please view the Barchart Disclosure Policy here.


/Nvidia%20logo%20by%20Konstantin%20Savusia%20via%20Shutterstock.jpg)
/Apple%20products%20on%20desk%20by%20Ake%20Ngiamsanguan%20via%20iStock.jpg)