
In my Q4 report on the grain sector on Barchart, I chronicled how the grain sector posted a marginal 0.66% decline in Q4 2022 and a 1.72% gain over the year. Looking forward to 2023, I wrote, “Expect lots of volatility in the grain and oilseed sector in 2023, and you will not be disappointed. Continuing war could push prices to new all-time highs, while an end to hostilities could cause a significant downside correction. Fasten your seatbelts for 2023.”
The full text of the USDA’s January WASDE is available via this link. On January 18, 2023,nearby soybean futures were highs, while corn and wheat prices were not far below the 2022 closing prices.
Sal Gilberte’s take on the January WASDE report
Sal Gilberte is the founder of the Teucrium family of agricultural ETF products, including the CORN, SOYB, and WEAT ETFs. On January 12, Sal told me:
The combined release of the January WASDE report and the Quarterly Grain Stocks report was surprisingly bullish, especially for corn and soybean markets, reflecting unexpectedly high disappearance (usage) of corn and wheat, a reduction in planted and harvested corn acres, and a general reduction in per acre corn and soybean yields versus last year due to persistent dry conditions across U.S. grain growing regions. In addition, the estimates for Argentine soybean production from the USDA are currently significantly higher than official estimates by private Argentine analysts, which could portend a further tightening of the global soybean balance sheet. The U.S. will use more corn, soybeans, and wheat than it produces, portending a continued tightness in overall U.S. balance sheet grain supplies for a third consecutive year. Offsetting the bullish news is the expectation that Brazil will produce a record soybean crop and that China will import fewer soybeans than last year. Attention will be on the upcoming Brazilian harvest and on U.S. weather patterns heading into spring; rains are badly needed across the grain belt to recharge depleted moisture levels. Much of Kansas is in severe drought and more than half of the corn belt is currently classified in some sort of official drought condition. It is early in the season, and anything can happen, but one thing is certain: rain is needed in the North American farm belt in order to achieve current projected production estimates.
Sal had a bullish take on 2023’s first WASDE report.
Soybeans move higher after the January WASDE- Crush spreads continue to support higher bean prices
The USDA lowered U.S. oilseed production for 2022/2023 and slightly increased worldwide soybean ending stocks. However, soybean futures prices for March delivery moved higher in the wake of the January WASDE report.
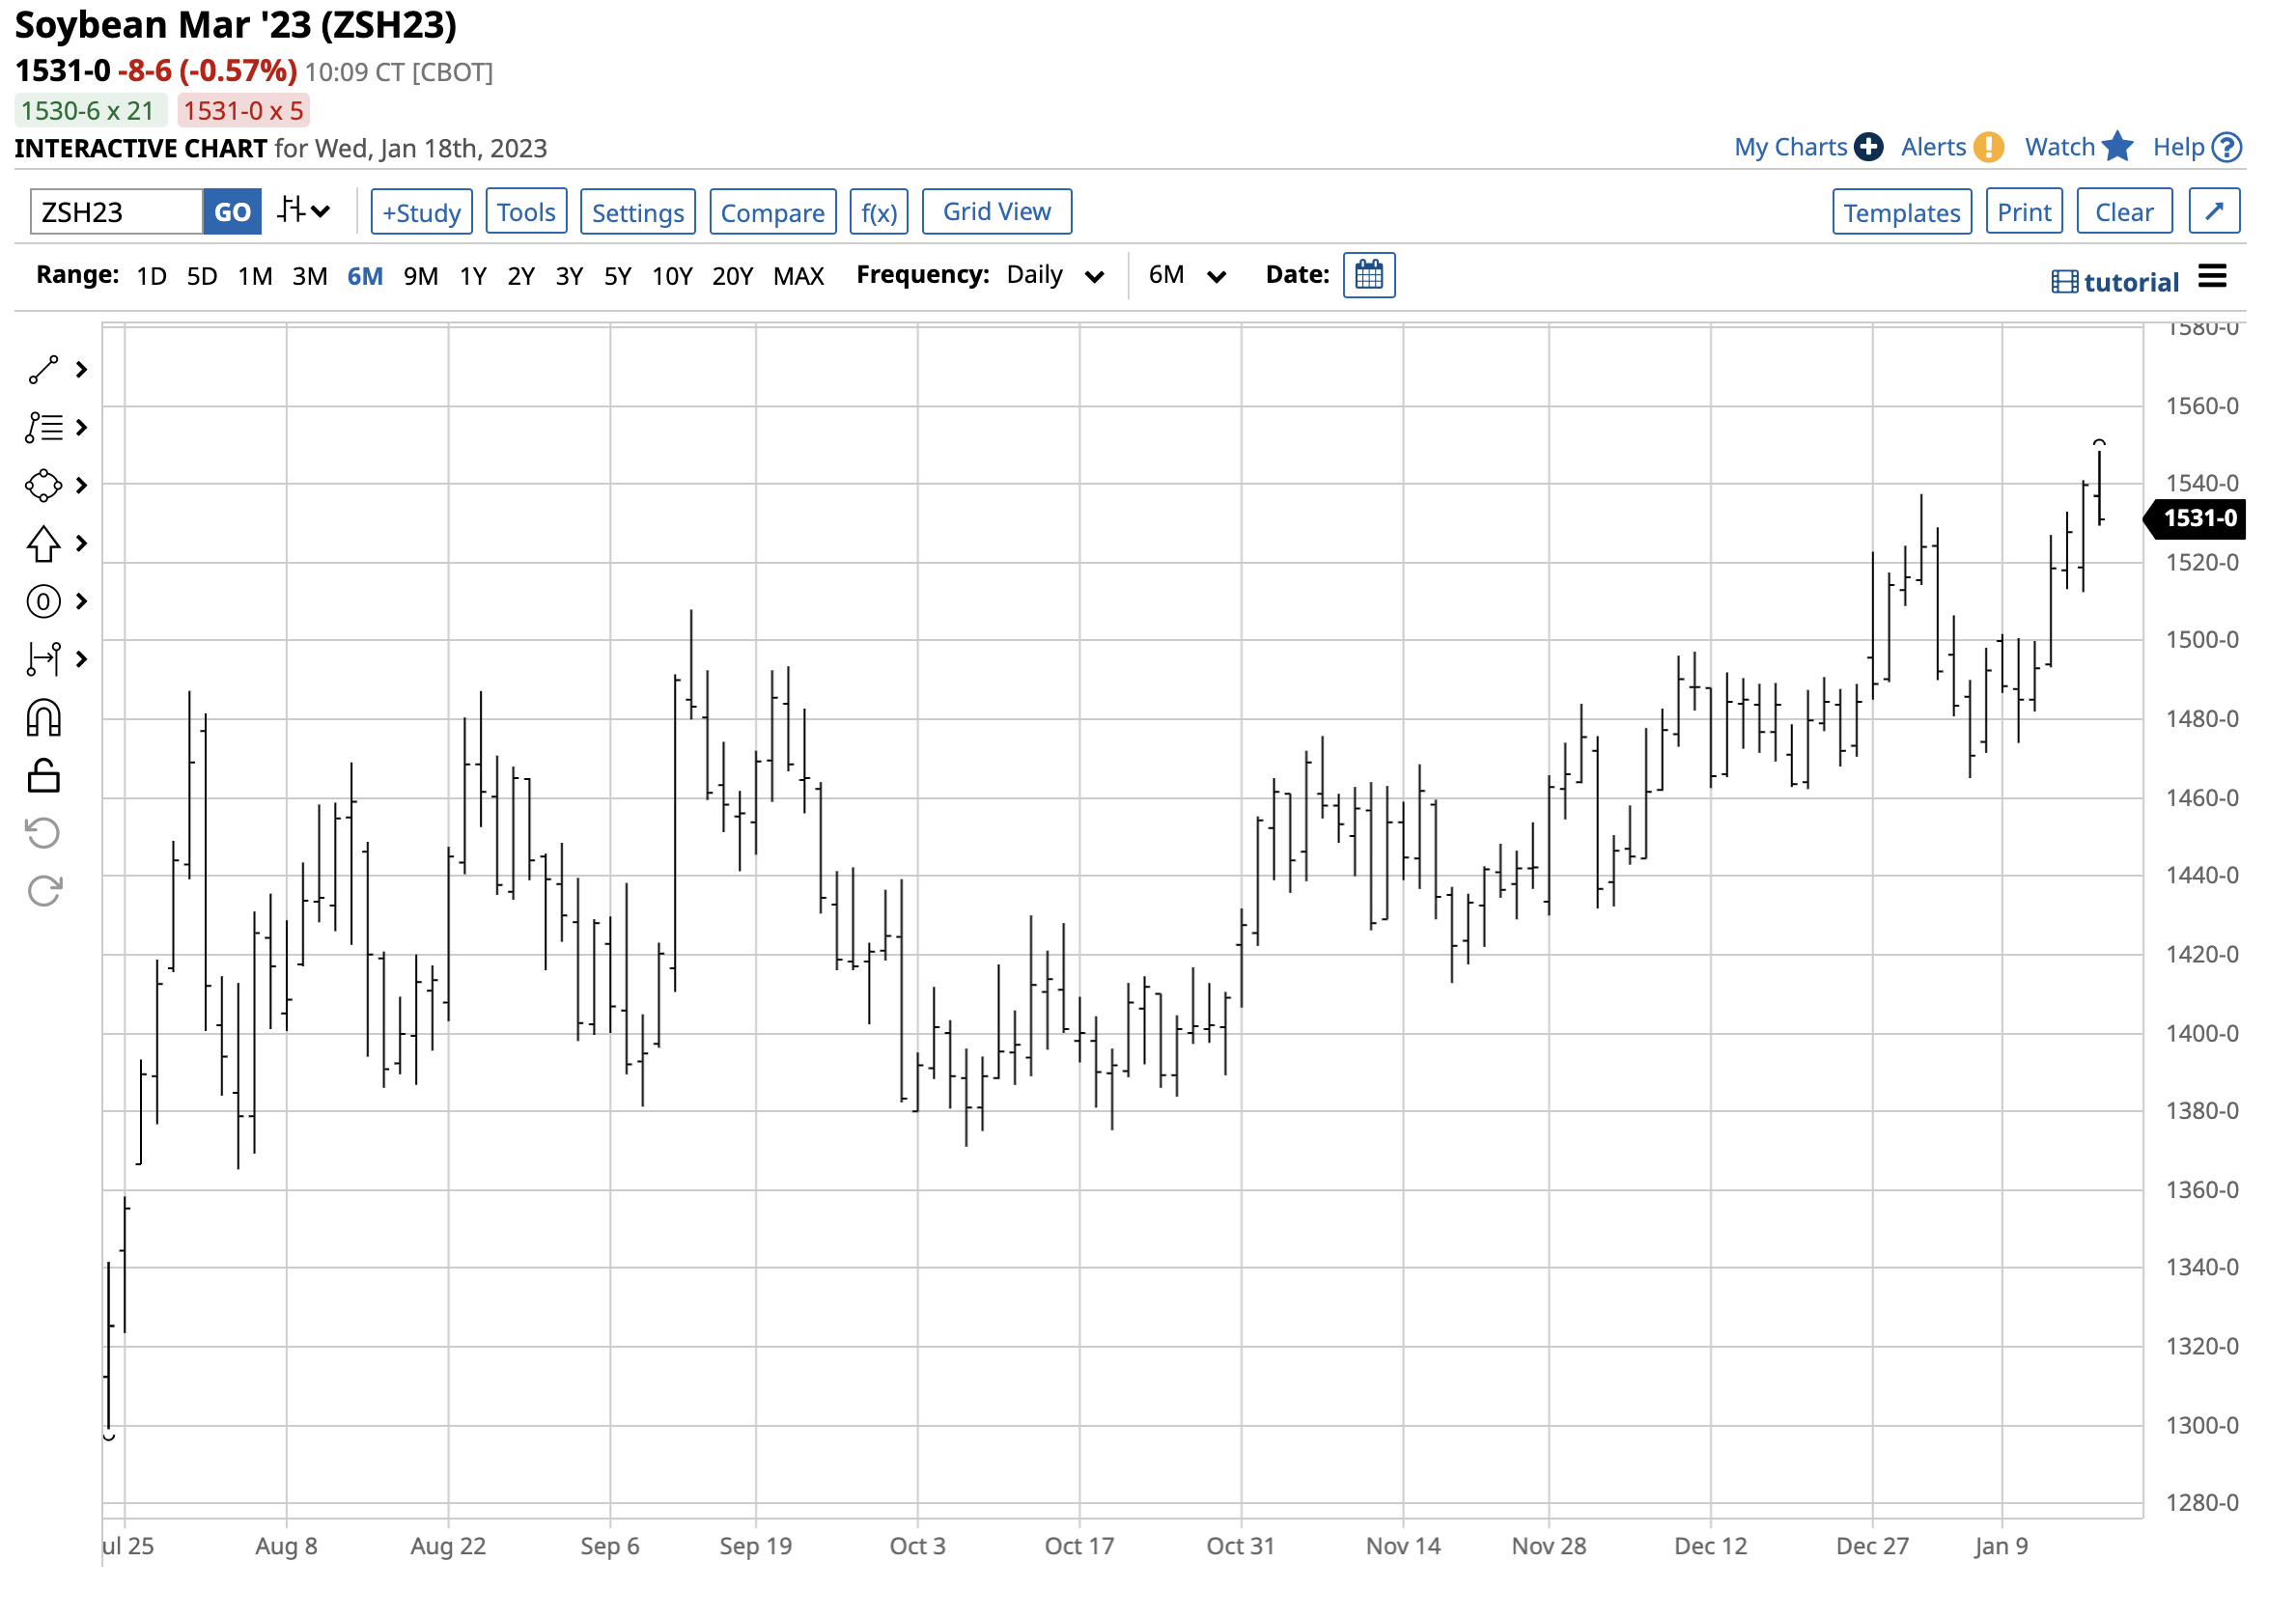
The short-term chart highlights the pattern of higher lows and higher highs in the soybean futures market. After the USDA’s latest report, soybeans prices moved over the $15.30 per bushel level.
Processors crush soybeans into two products, meal and oil. The crush spread is a real-time demand indicator for the oilseeds.
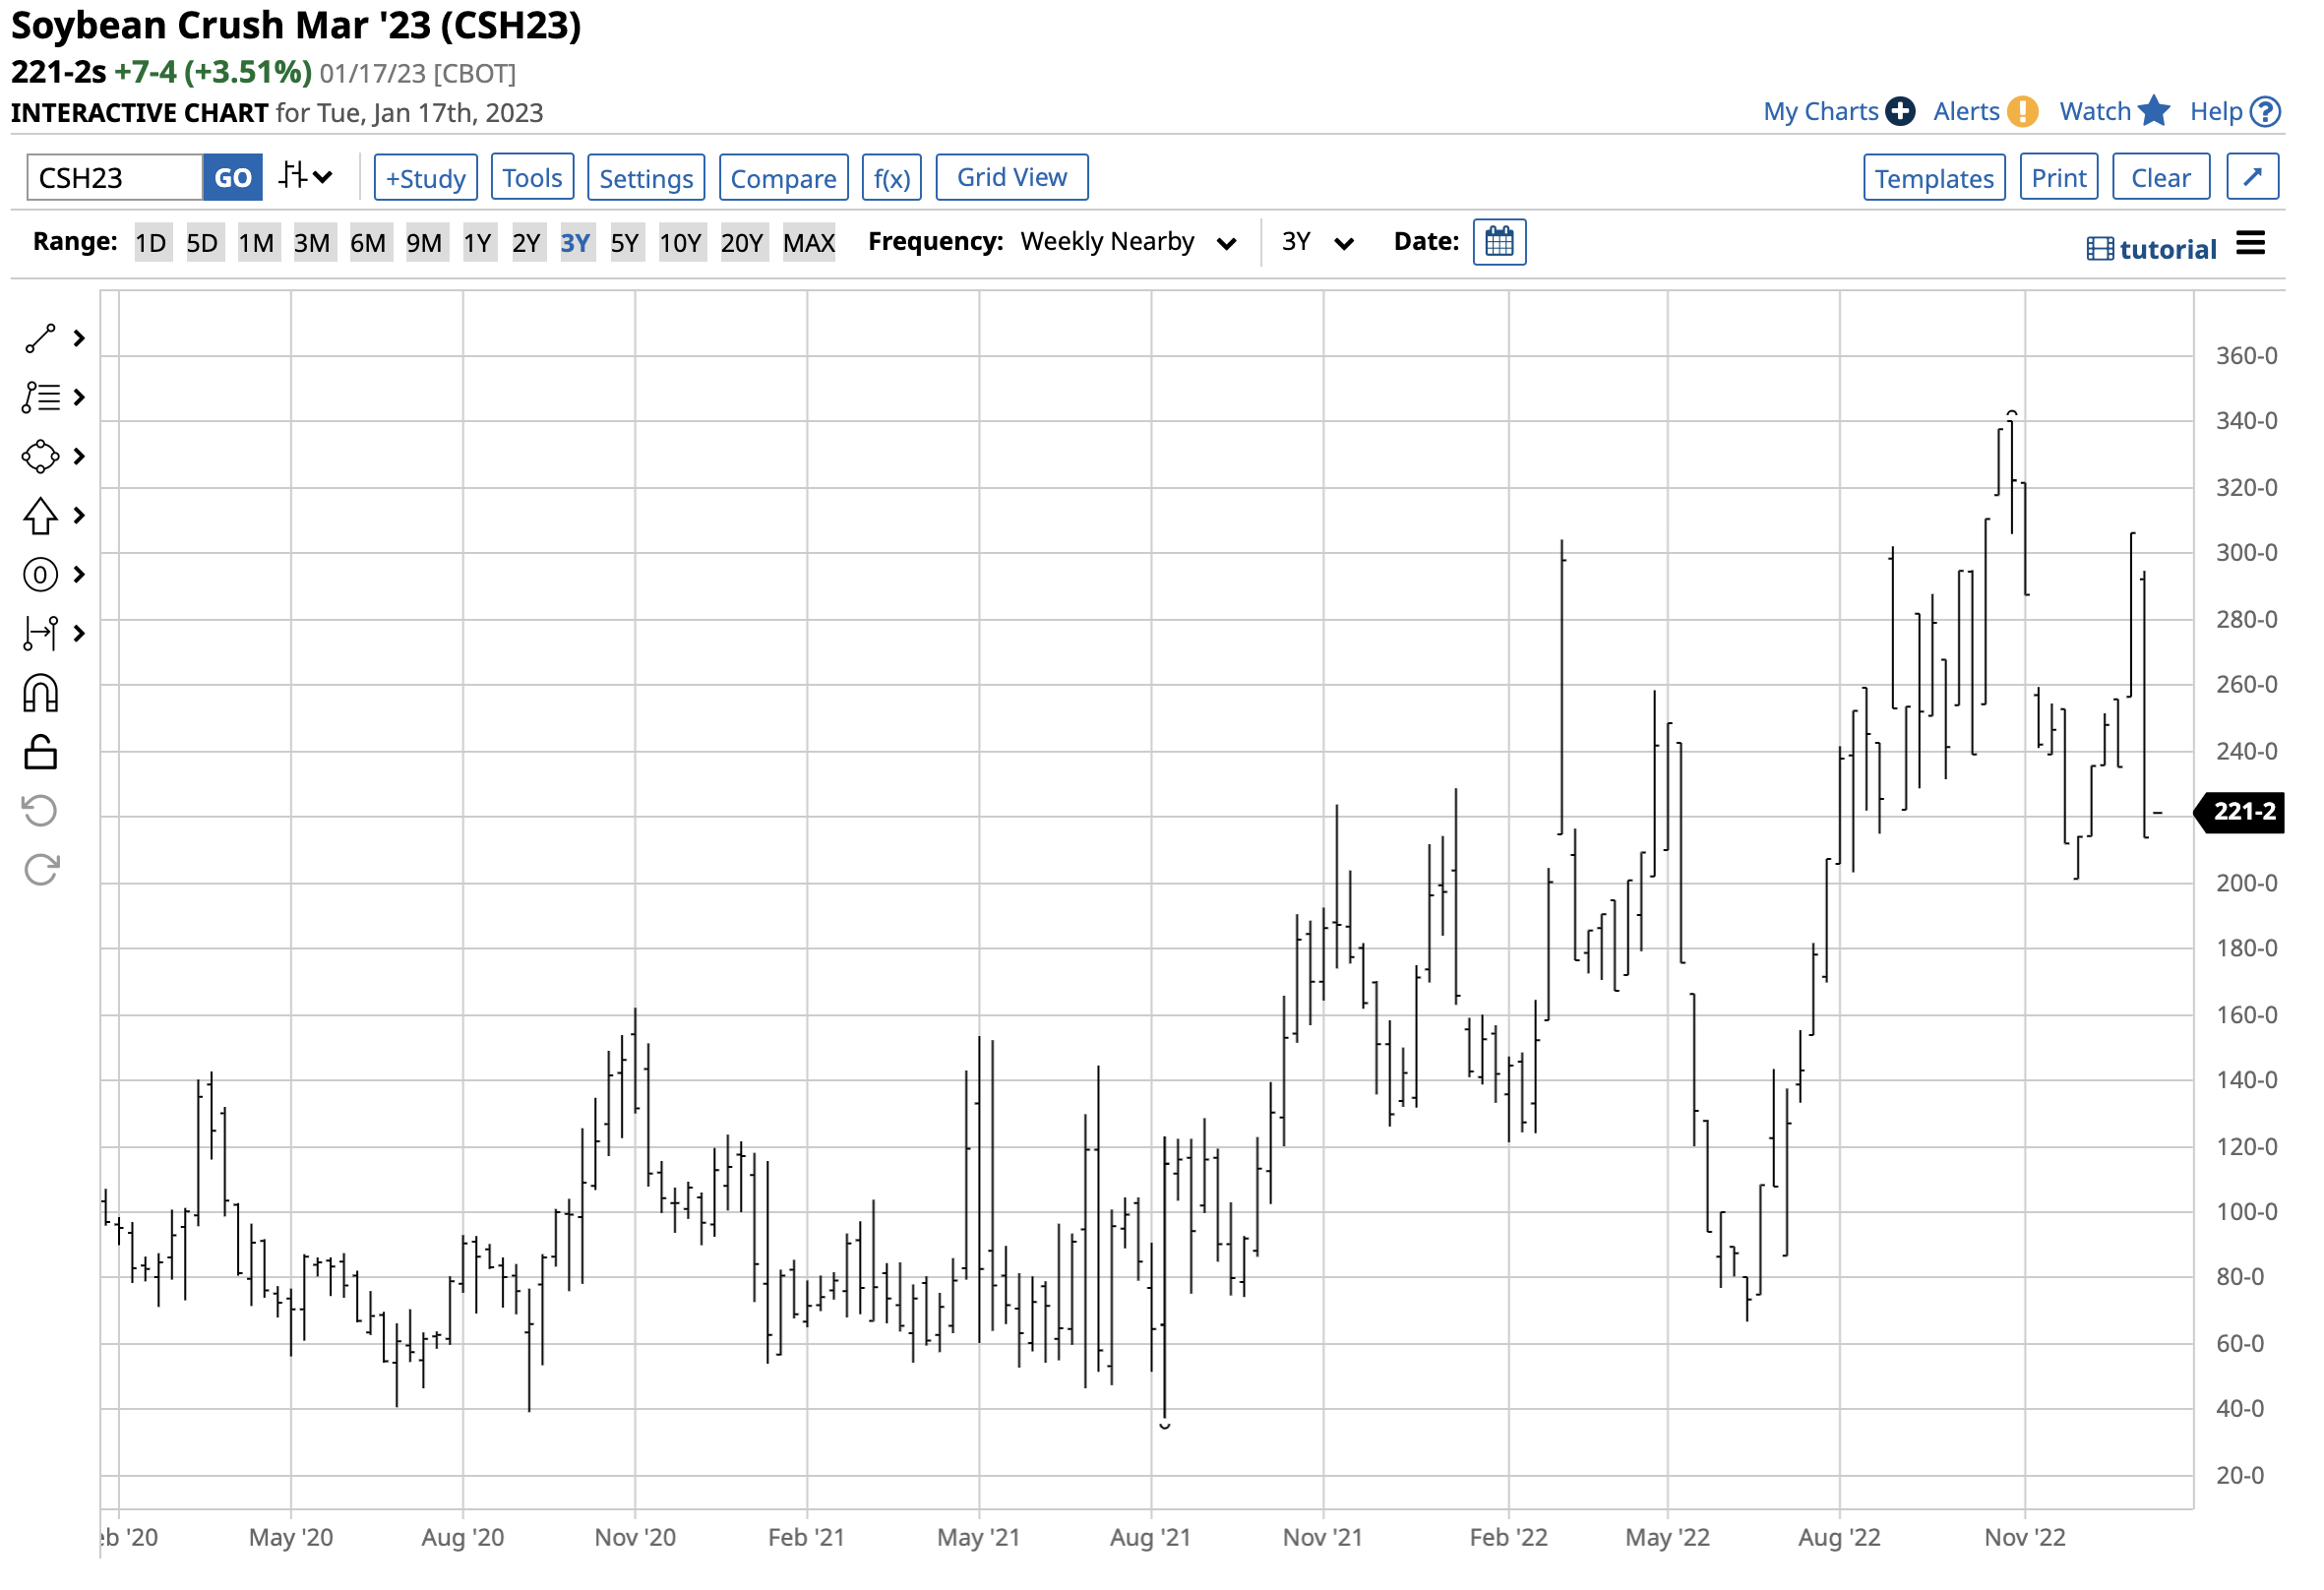
At over $2.20 per bushel, the soybean crush spread has been trending higher, indicating the high demand for soybean products, supporting the underlying oilseed’s price.
Corn rallied after the report- Oil and gasoline prices support corn
Corn prices moved higher in the aftermath of the January WASDE report.
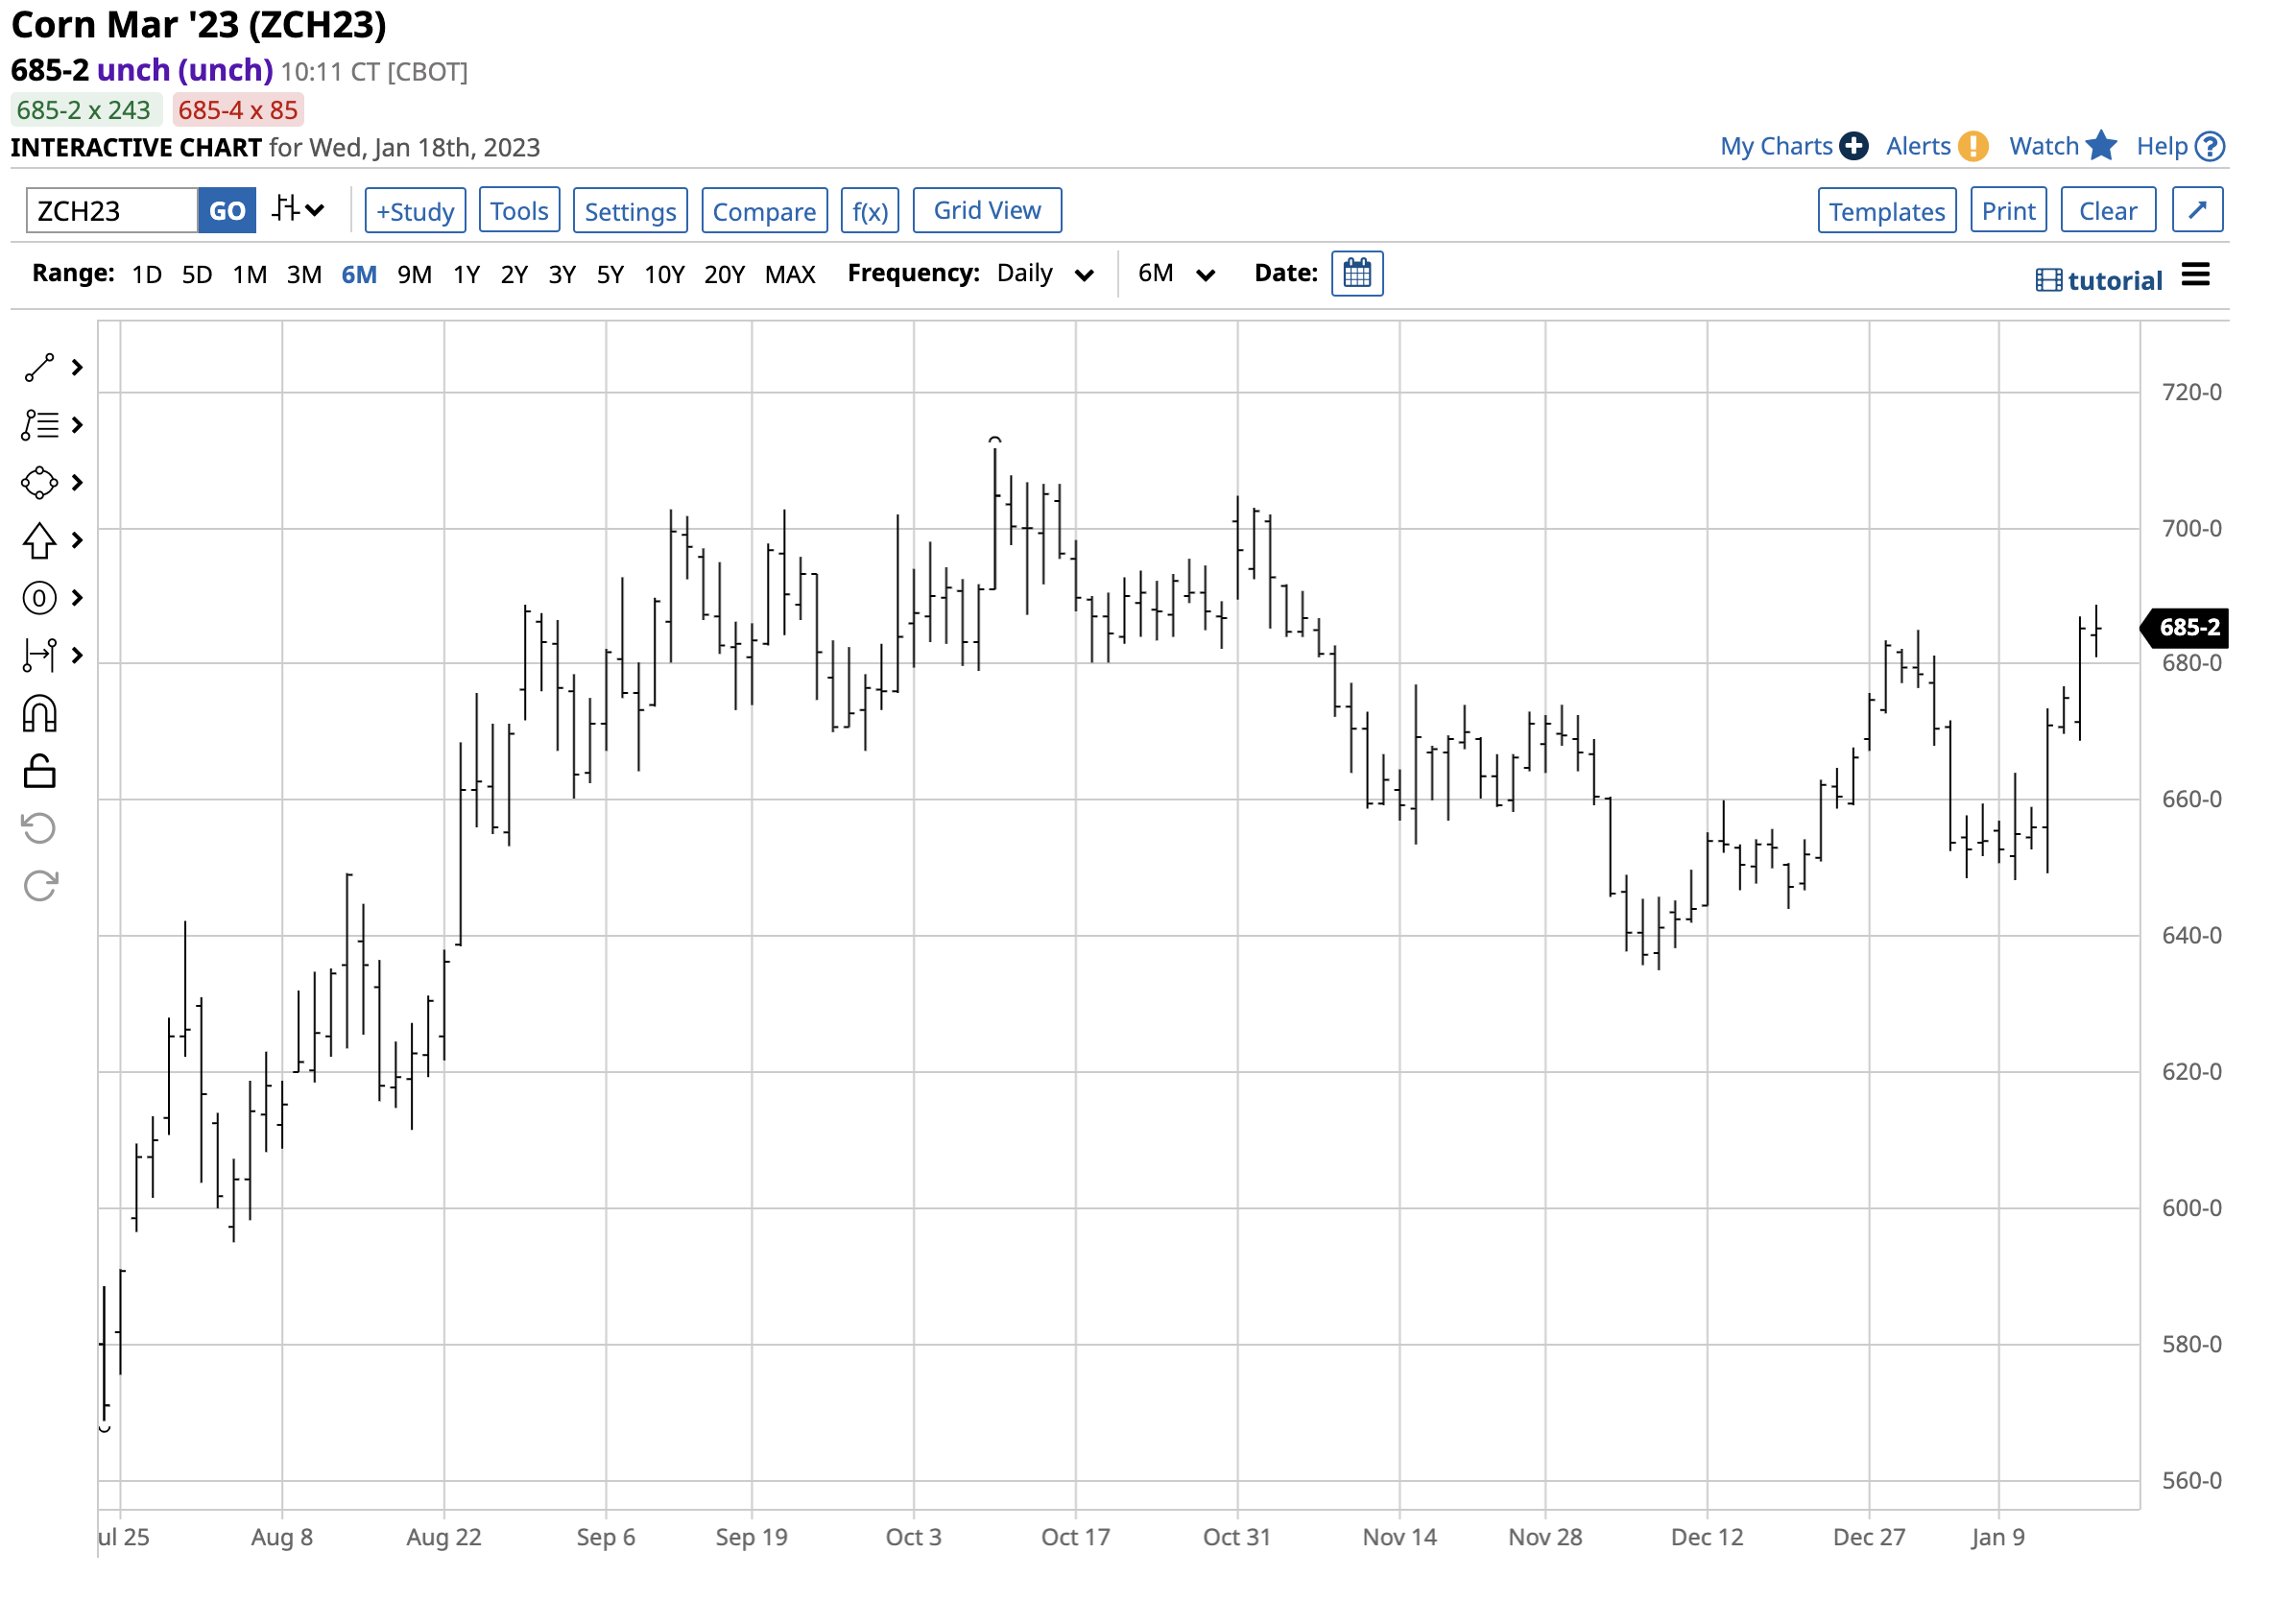
The March CBOT corn futures chart illustrates the bullish key reversal pattern on January 12. Corn futures fell below the January 11 low and closed above its high, a bullish technical signal for the corn futures market.
Corn is the primary ingredient in U.S. ethanol production. Since the U.S. mandates a gasoline-ethanol blend, rising gasoline tends to support ethanol, which supports corn prices. After reaching a short-term seasonal low in mid-December, gasoline futures prices have been trending higher, and crude oil prices have also increased over the past weeks.
The USDA told the corn market that U.S. and global corn stockpiles declined from the December WASDE report.
Wheat edges higher in post-WASDE trading- The war in Europe’s breadbasket is the critical factor supporting wheat
CBOT soft red winter wheat prices, the global benchmark for the grain that is bread’s primary ingredient, edged only marginally higher after the January WASDE report.
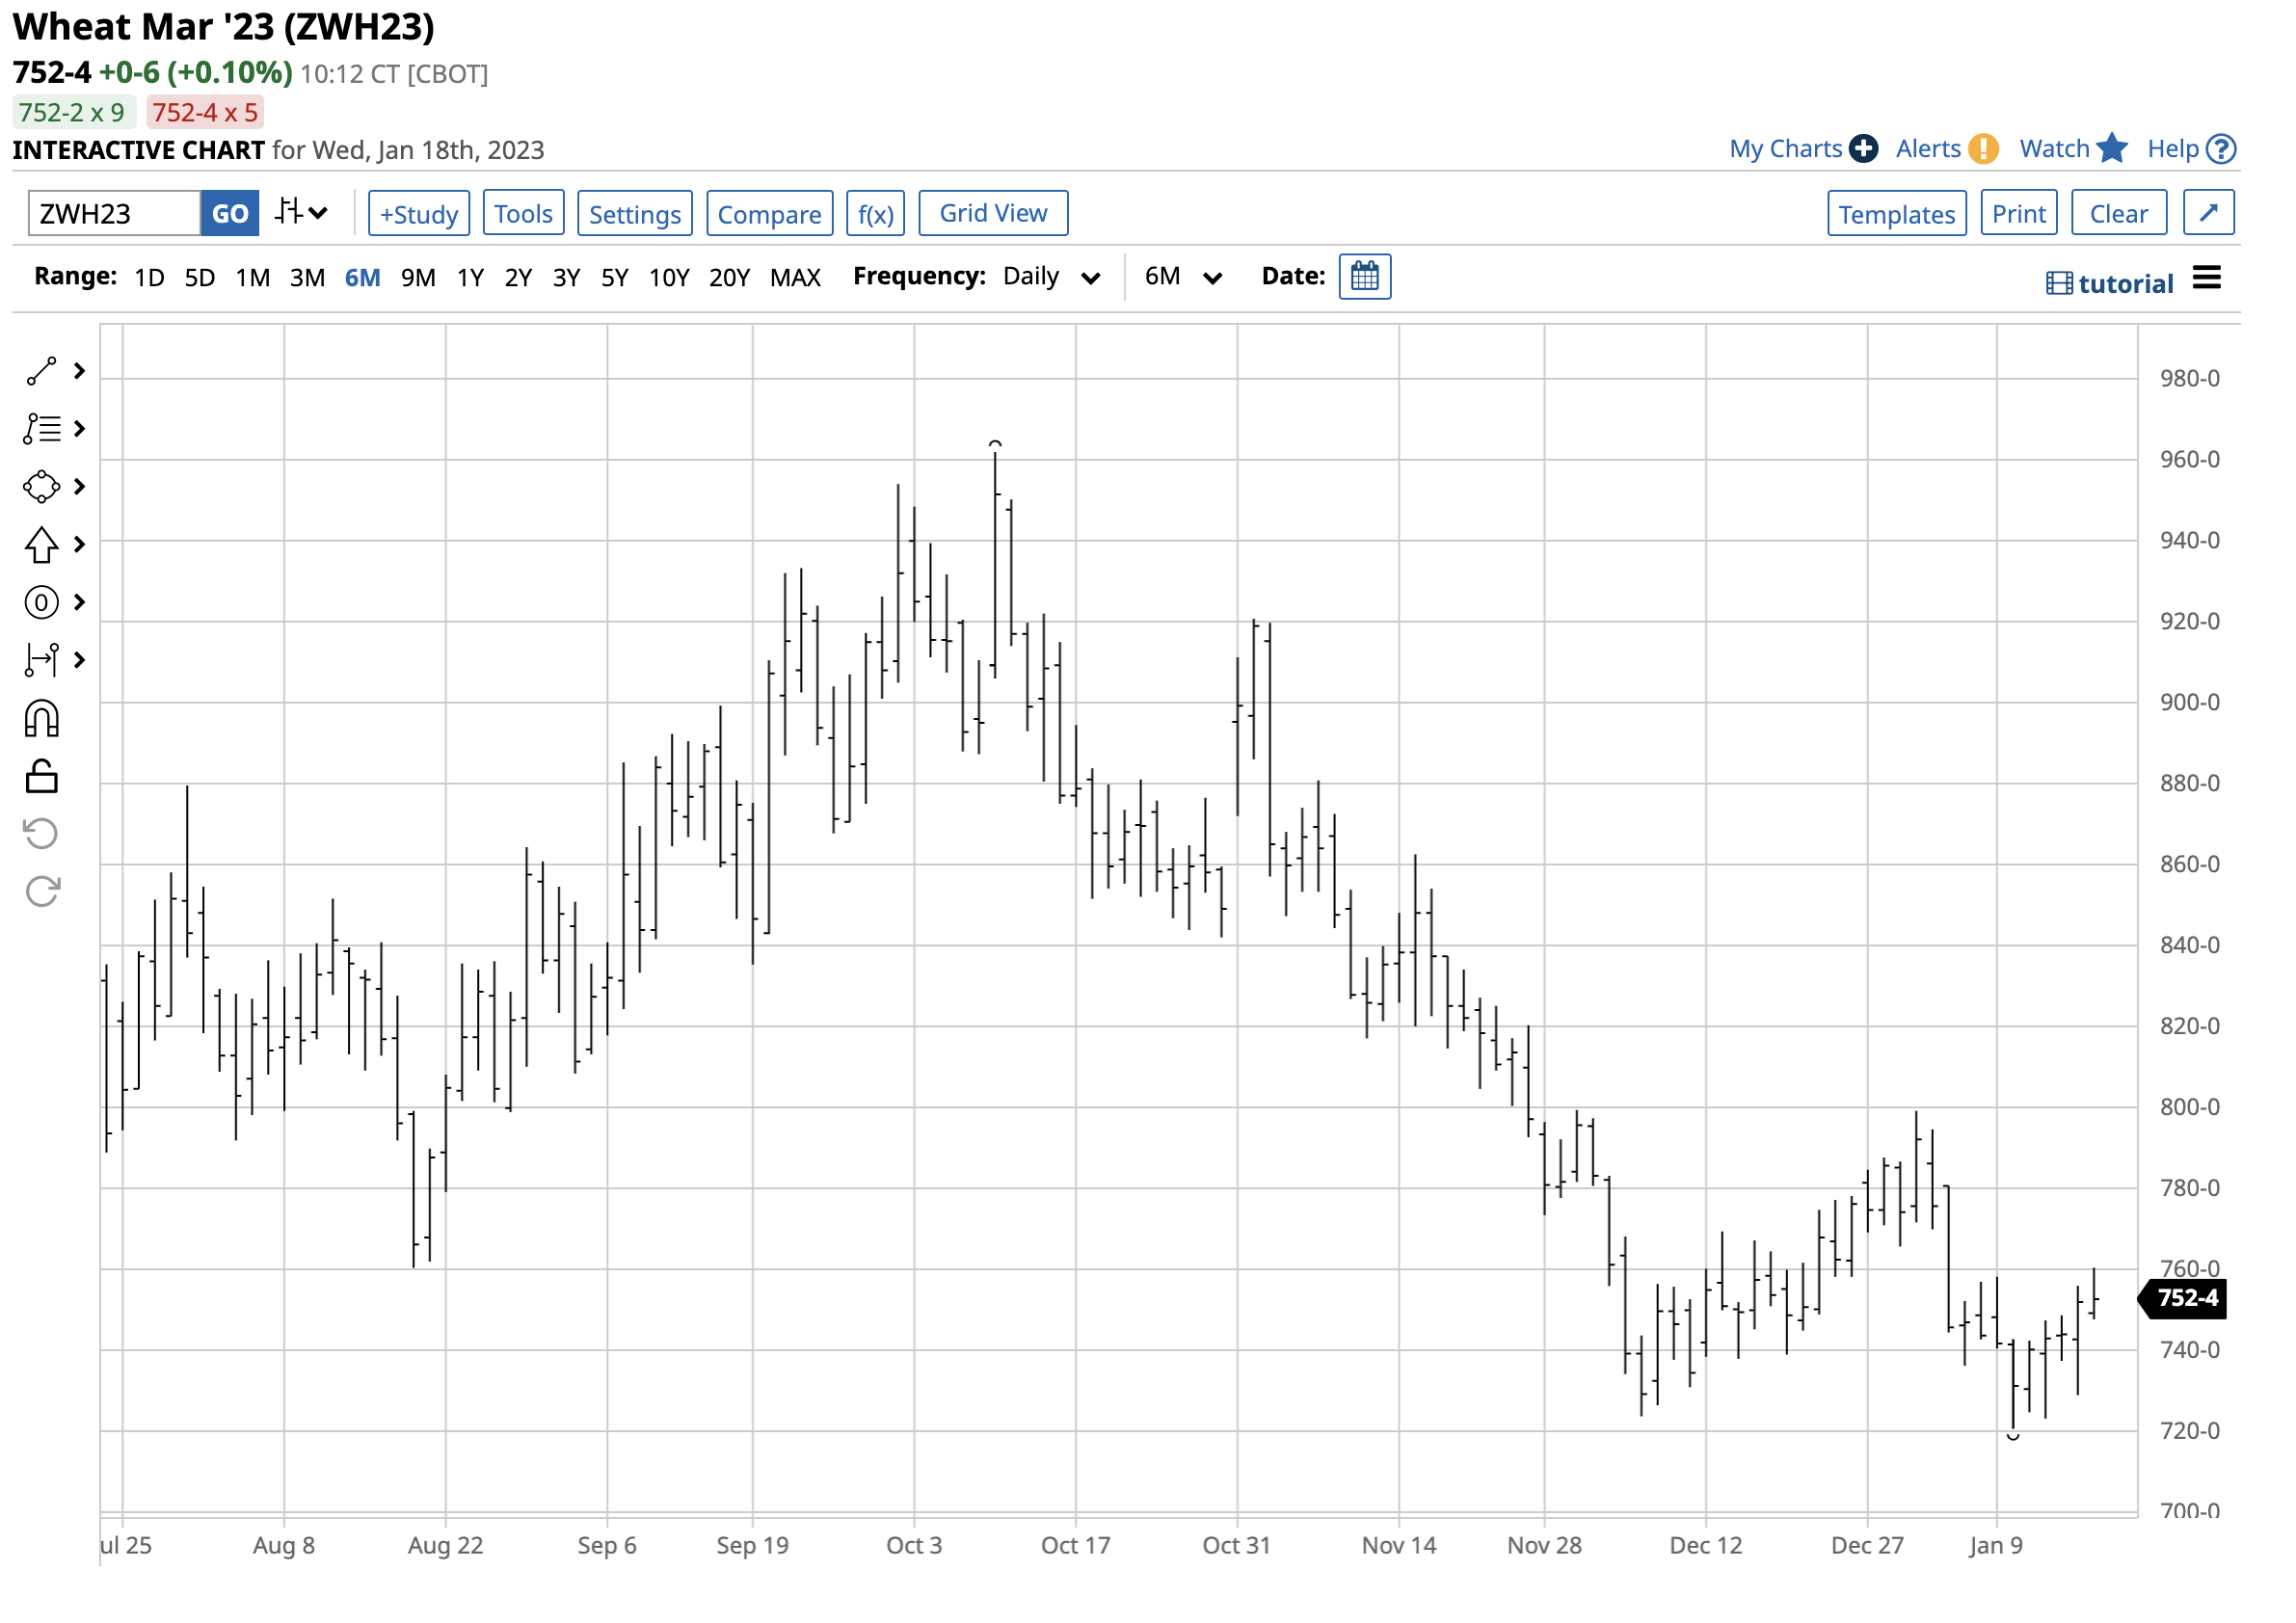
The chart shows a slight rise in CBOT wheat futures after the January 12 report. The USDA said U.S. wheat stocks declined while worldwide inventories moved higher.
The KCBT hard red winter wheat versus the CBOT soft red winter wheat spread stood at over a $1 per bushel premium for the KCBT wheat futures on January 18. The long-term average is a 20 to 30 cents premium for KCBT wheat, so the spread is historically elevated. In a November 4, 2022, article on Barchart, I highlighted that the elevated premium for KCBT wheat is a bullish factor for the grain. The high level of the spread reflects increased consumer hedging as supply and price concerns continue to grip the wheat market. Russia and Ukraine are Europe’s breadbasket and leading wheat producers and exporters. As the war in Ukraine continues to rage in early 2023, supply fears continue to dominate the international wheat market.
Fertilizer supplies and the weather will determine the path of least resistance of prices in 2023
As the soybean, corn, and wheat markets move toward the 2023 planting season in the Northern Hemisphere, the ever-growing demand as the population grows stresses the balance sheets as farmers need to produce ever-increasing levels of grains and oilseeds. Russia is a leading fertilizer producer and exporter. As fertilizer prices have soared and Russia is using fertilizers and other critical commodities as economic weapons against “unfriendly” countries supporting Ukraine, shortages have developed, which could weigh on the 2023 crop yields.
The path of least resistance of soybean, corn, and wheat prices in 2023 will be a function of the weather conditions across the fertile growing regions worldwide. However, high fertilizer prices and the ongoing war in Ukraine could limit any downside pressure in prices that remain at multi-year highs. Sal Gilberte’s take on the January WASDE was bullish, and prices have trended higher in the days following the report.
The most direct route for a risk position in the grain and oilseed markets is via the futures and futures options on the CME’s CBOT division. The Teucrium family of grain and oilseed ETFs provides an alternative for exposure to the markets that feed the world:
- At $28.26 per share, the Teucrium Soybean ETF (SOYB) had $54.11 million in assets under management. SOYB trades an average of 59,077 shares daily and charges a 0.24% management fee.
- At $26.89 per share, the Teucrium Corn ETF (CORN) had $152.736 million in assets under management. CORN trades an average of 130,409 shares daily and charges a 0.25% management fee.
- At $7.59 per share, the Teucrium Wheat ETF (WEAT) had $207.593 million in assets under management. WEAT trades an average of 819,436 shares daily and charges a 0.22% management fee.
The Teucrium ETFs hold portfolios of three futures contracts to minimize roll risks. Since the most volatility tends to occur in the nearby contracts, as they attract the most speculative activity, Teucrium ETFs tend to underperform the grain and oilseed futures on the upside and outperform when prices decline.
Given the ongoing war in Ukraine, the ever-growing demand for food, and new demand from the biofuel sector, any significant corrections in the soybean, corn, and wheat futures market could continue to be buying opportunities in 2023.
More Grain News from Barchart
- Wheat Adding to Gains
- Soybeans Fade overnight Gain
- Fractionally Mixed Corn Board
- Tuesday Wheat Traded Higher
On the date of publication, Andrew Hecht did not have (either directly or indirectly) positions in any of the securities mentioned in this article. All information and data in this article is solely for informational purposes. For more information please view the Barchart Disclosure Policy here.
/Microsoft%20headquarters%20By%20Peter.jpeg)
/NVIDIA%20Corp%20logo%20outside%20building-by%20BING-JHEN_HONG%20via%20iStock.jpg)
/Micron%20Technology%20Inc_%20logo%20on%20building-by%20vzphotos%20vis%20iStock.jpg)
/Amazon%20-%20Image%20by%20bluestork%20via%20Shutterstock.jpg)