
- Historically, commodity futures have not been viewed as long-term investment due to both their volatile nature and the fact positions must constantly be rolled forward.
- However, one could look at Exchange Traded Futures, with the set I track being Teucrium funds.
- Here we see corn, soybeans, and wheat all at various stages of long-term downtrends with the key difference being their respective long-term real fundamentals.
Understandably, trading commodity futures isn’t for everyone. Those who view the world as a set of long-term investment opportunities have learned first-hand the legendary short-term attention spans most commodity markets have, though I have seen this characteristic change over the last 15 years or so. While there is still plenty of focus on day-trading, something I don’t remember fondly from my brokerage/trading days, there has also been an evolution toward viewing some commodities as long-term investment vehicles. And no, that list does not include natural gas, in case you were wondering. It does, though, include the three major grain markets of corn, soybeans, and wheat. If one has a long-term view of how these markets should move over time, while not wanting to play in the casino known as futures (with all the futures spreads and rolling required) there are a number of Exchange Traded Funds (ETFs) oner can look. I track the Teucrium ETFs, as they tend to follow their technical patterns as well as any.
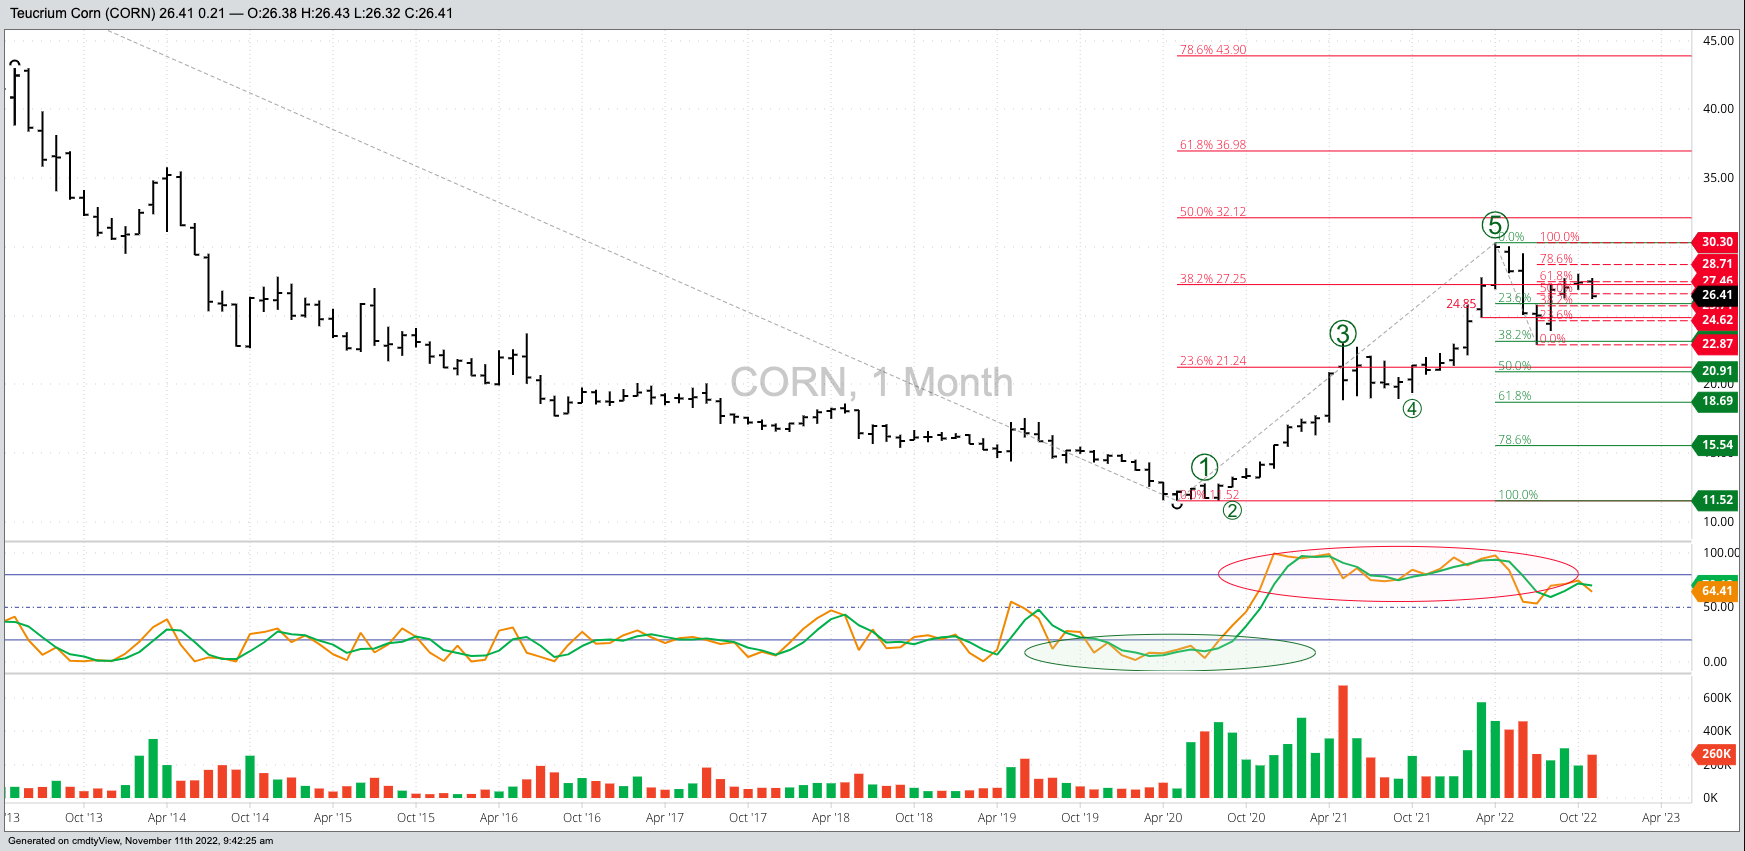
As always, let’s start with King Corn. The Teucrium Corn fund (CORN) has followed a clear long-term 5-wave uptrend pattern on its monthly chart, though the bearish reversal following the Wave 5 peak this past April was not as clear as what we see on the continuous monthly chart for Dec corn only. With CORN, a top wasn’t actually confirmed until a new 4-month low was posted during July. However, a close look at the chart shows the spike low of $22.87 posted during July was also the end of Wave A (first wave) of the new 3-wave downtrend. Since then, CORN has closed higher three consecutive months (bringing to mind a Benjamin Franklin Fish Similarity[i]). Given that, when Wave B (second wave) tested the upside target of $27.46 it looks to have been met with sellers still targeting a long-term downside target in the $20.91 to $18.69 range.
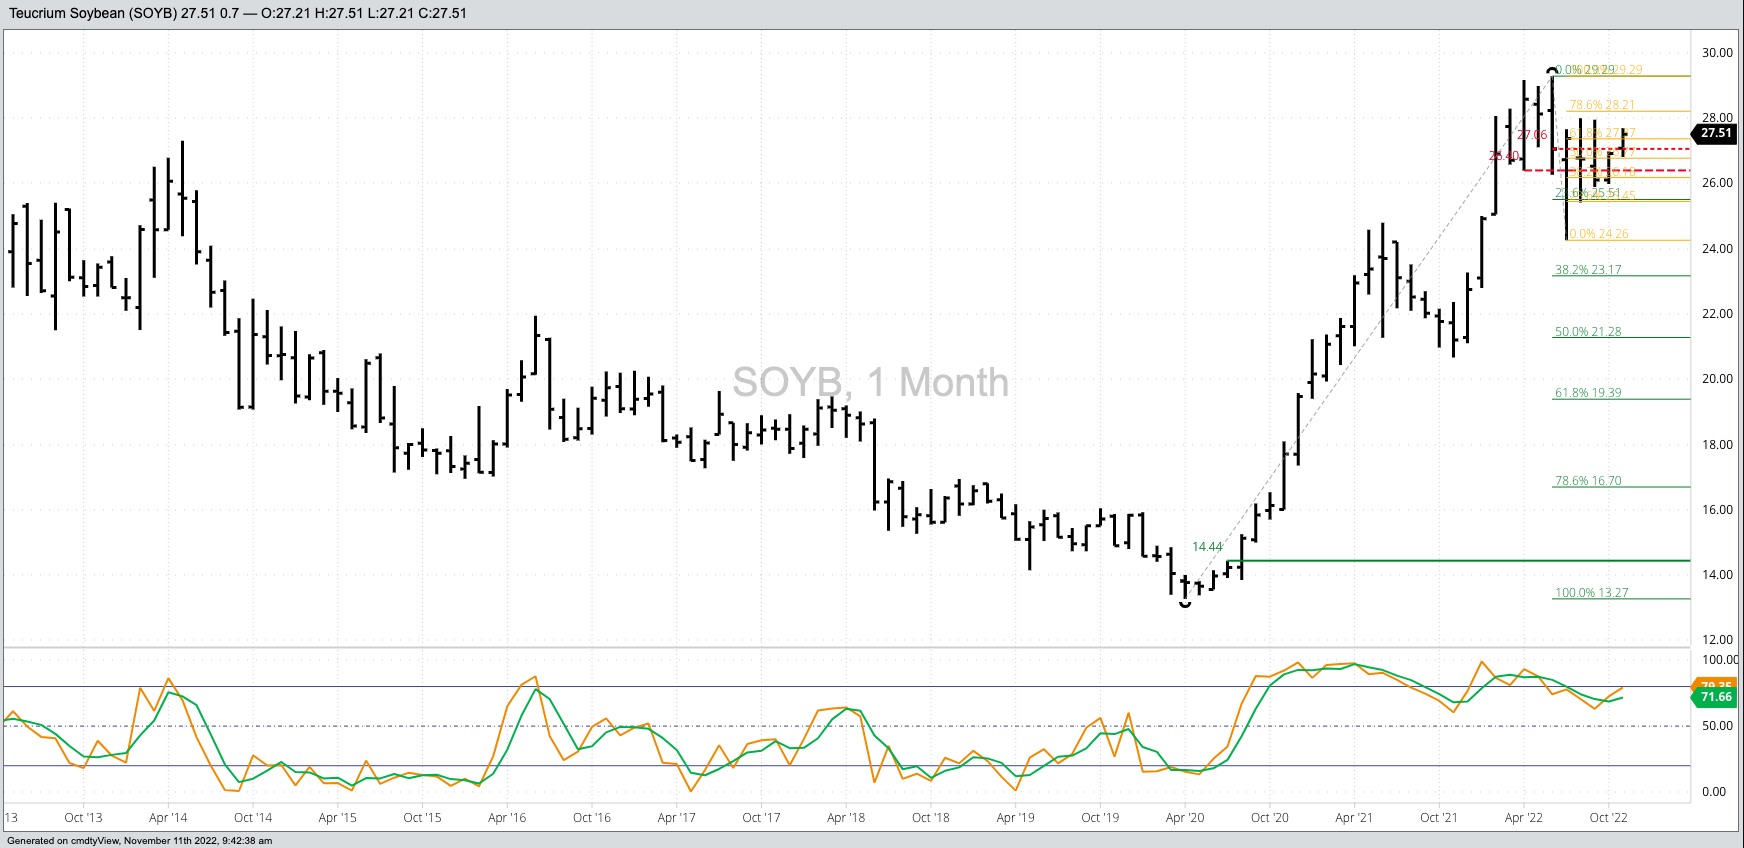
The soybean (SOYB) month chart isn’t quite as clean, but then again why would it since it’s based on soybean futures. However, SOYB did complete a bearish key reversal during June confirming the market had moved into a long-term downtrend. Wave A came to an abrupt end with the July low of $24.26, leading to a consolidation phase that could be considered Wave B. Once SOYB takes out its Wave A low the stage would be set for Wave C to test the $23.17 to $21.28 range. As with CORN, the downside should be limited by long-term real fundamentals (cash, basis, futures spreads) that remain bullish.
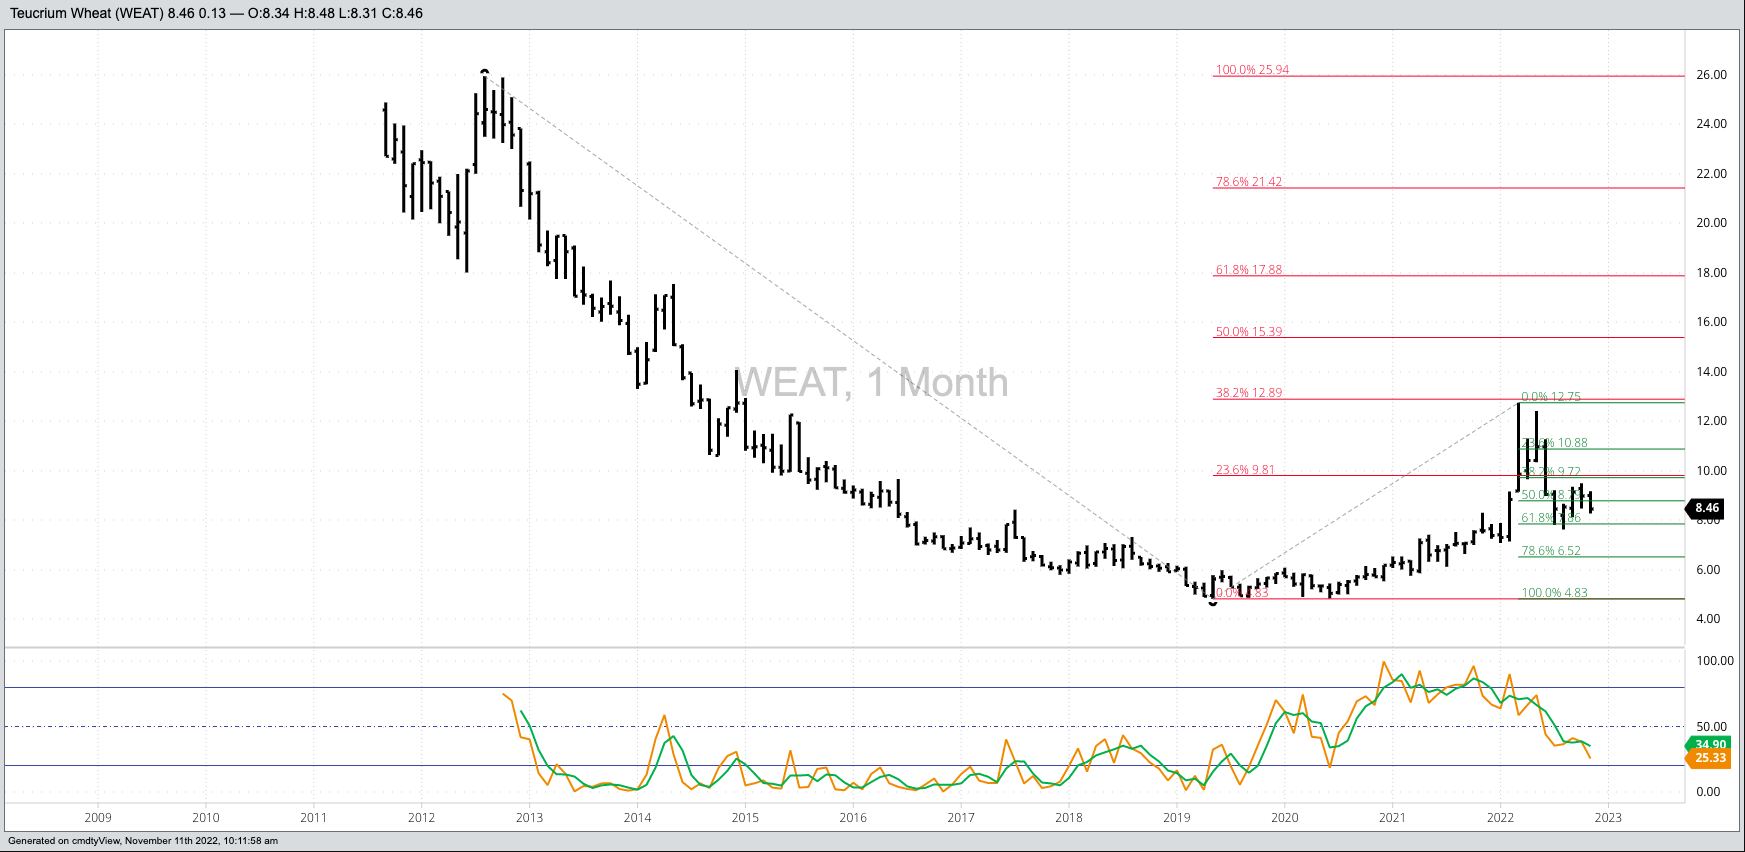
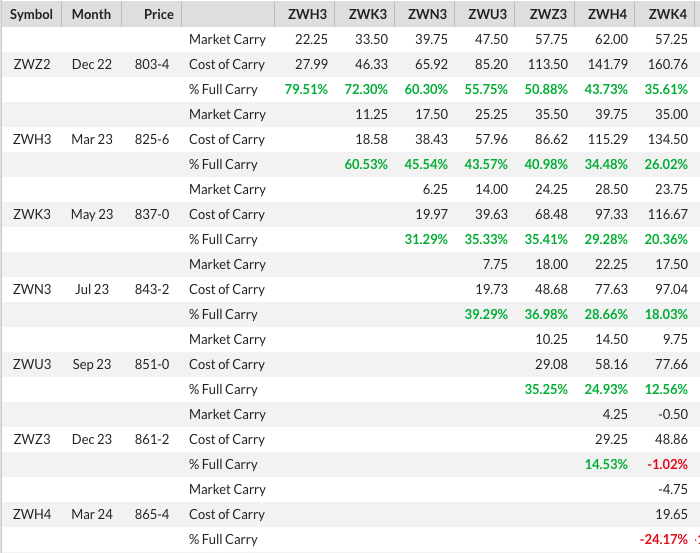
And then there’s wheat (WEAT). The market is also in a long-term downtrend, with Wave C expected to take out the Wave A low of $7.63. Fundamentally, Chicago (SRW) wheat is incredibly bearish, as indicated by Thursday’s close of the Dec-March futures spread covering 80% calculated full commercial carry (cfcc), with 67% the bearish threshold. Further out, the March-May was covering 61%. This leaves the door open for WEAT to do a deeper retracement of its previous uptrend that began with the May 2019 low of $4.83.
[i] The Benjamin Franklin Fish Similarity tells us that like guests and fish, markets start to stink after three months (days, weeks, whatever timeframe is being studies) of moving against the trend.
More Grain News from Barchart
- Friday Rally in Soy
- Wheats Bounce into Friday Day Session
- Corn Back In Black for Friday Trade
- Wheat Holds Relatively Firm

/Nvidia%20logo%20by%20Konstantin%20Savusia%20via%20Shutterstock.jpg)

/Apple%20products%20on%20desk%20by%20Ake%20Ngiamsanguan%20via%20iStock.jpg)
/Eli%20Lilly%20%26%20Co_%20by%20Tada%20Images%20via%20Shutterstock.jpg)