- Following Peter Lynch's advice of “Trade what you know”, corn has long been an attractive investment avenue for me.
- But not everyone is in the cash market or wants to trade futures, meaning we an look for companies who are tied to the stock market, with once that I track being Deere and Company.
- We can also look at Exchange Traded Futures, with one of the more well-known being Teucrium's CORN fund.
I’ve written a lot about the corn market lately, and for good reason. If I were an investor, I’d have a large part of my holdings tied to King Corn in some way or another. Those of you who have been following along know that from a technical point of view both the Barchart National Corn Price Index (ZCPAUS.CM), the weighted national average cash price and what I use as the intrinsic value of the market, and December corn futures (ZCZ22) completed long-term bearish technical reversal patterns on their respective monthly charts during May (Dec22) and June (NCPI). Since then, option strategies have emerged where traders get to live out the Speedo Situation[i].
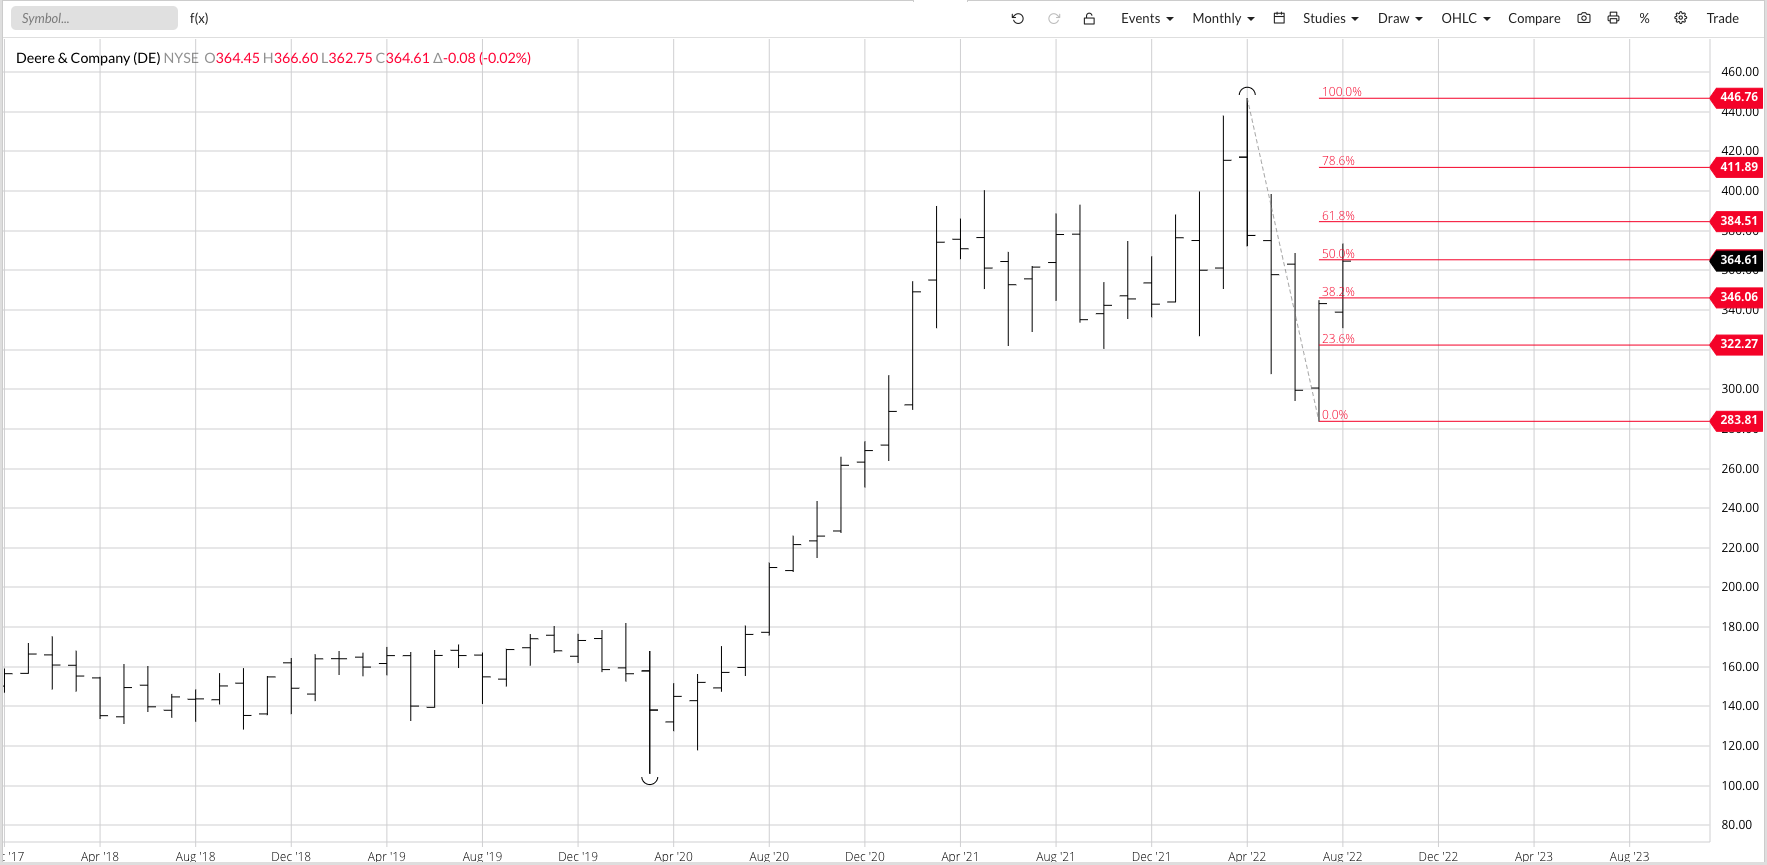
Understandably, though, not everyone who wants to be involved with King Corn has cash grain to sell or looks longingly at the chaos and volatility in futures and says, “Yes, I want some of that.” For these investors there are a number of companies that find themselves tied to corn, with Deere & Company (DE) one of my favorites to track. What I find interesting with Deere is that it has been leading King Corn, with the company’s stock completing a bearish spike reversal during April indicating its long-term trend had turned down. Deere then moved lower during May and June before posting a spike low during July and rallying through the first half of August. Based on the Benjamin Franklin Fish Similarity[ii], we would expect Deere to close higher at the end of August and September before turning lower again in October. The upside target range is between $365.29 and $384.51, with the stock already poking its head up to $373.37 this month.
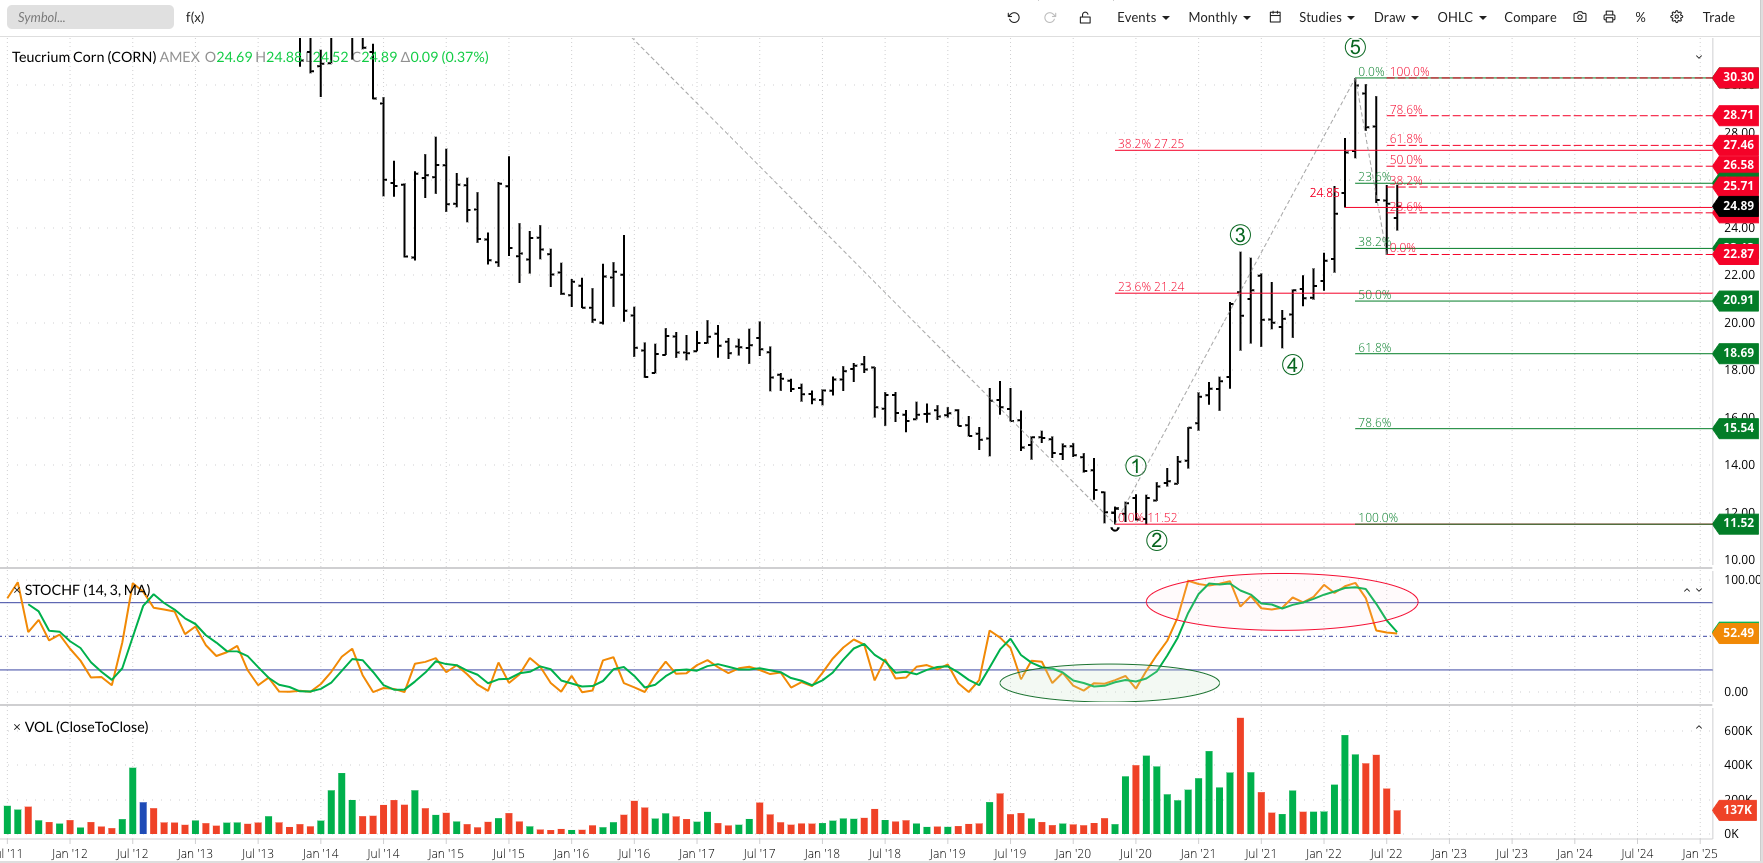
Another way investors who might not know what a corn plant looks like can be involved with the market is through Exchange Traded Funds (ETFs). One of the ETFs I’ve watched closely over the years is Teucrium’s CORN fund (CORN), as it shows similar patterns to both the NCPI and December corn, though often with cleaner moves. A quick look at CORN’s monthly chart and we can clearly see the previous 5-wave uptrend play out, with the peak occurring at the April high of $30.30 (note the similarity to Deere). However, unlike Deere that posted a well-defined bearish spike reversal, CORN didn’t complete a reversal pattern until it took out its previous 4-month low of $24.85 during July. CORN now looks to be in Wave B (second wave) of its 3-wave downtrend with an upside target area between $26.59 and $27.46.
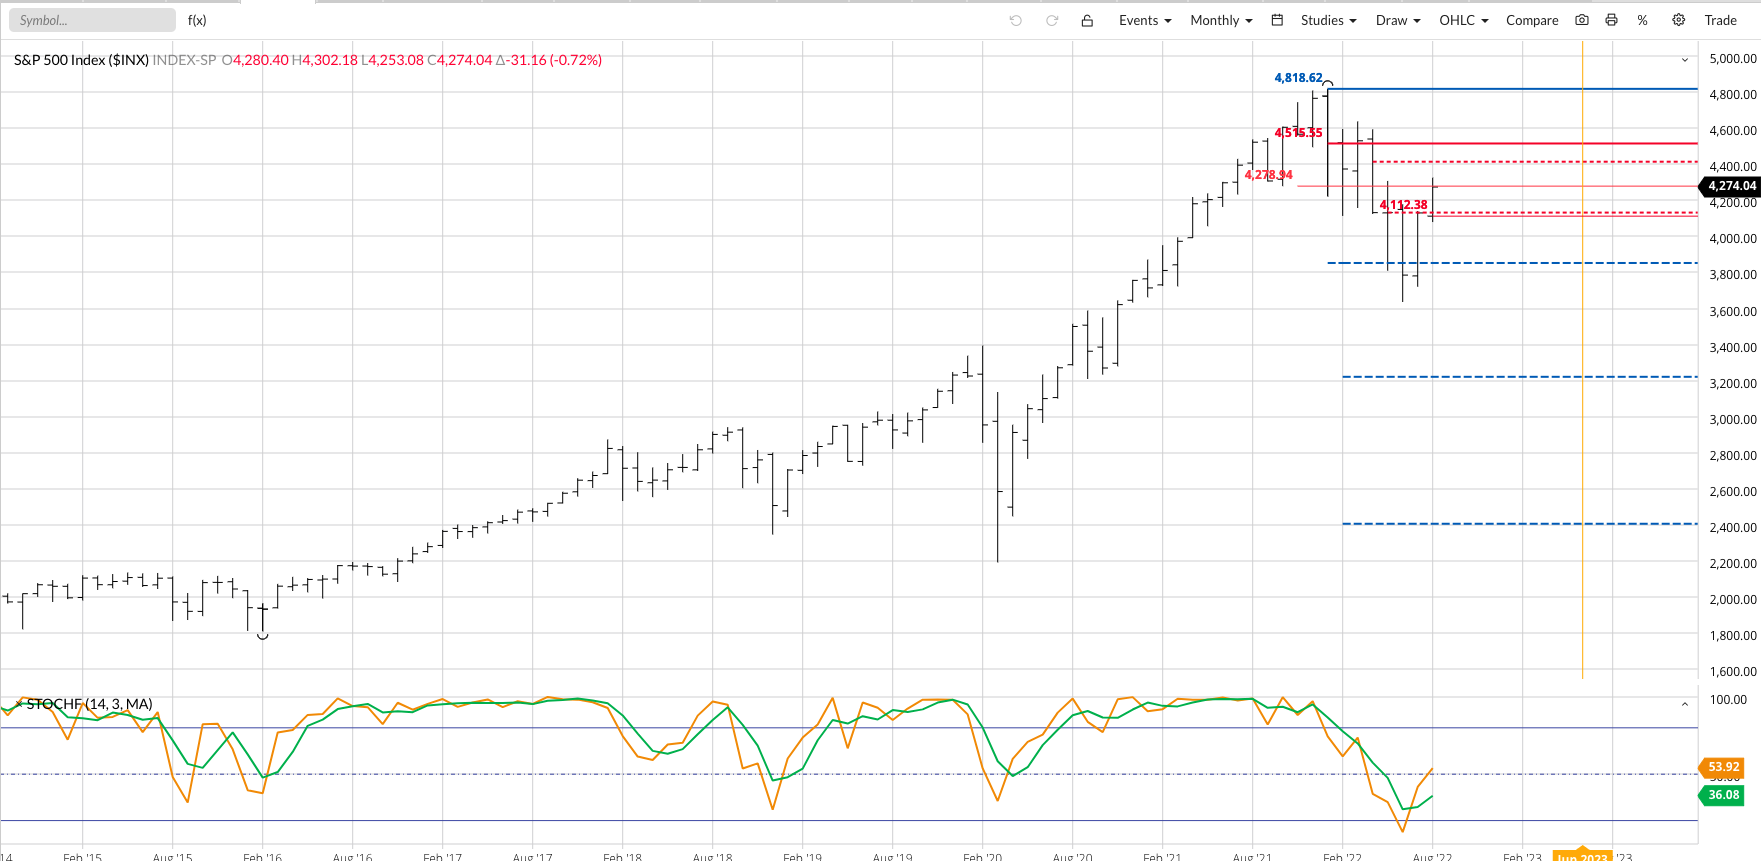
A couple things to keep in mind is again the long-term downtrend of the NCPI and the S&P 500 index. As I talked about earlier this month, I still see the S&P in a long-term downtrend though going through its own 3-month Wave B rally. Eventually, this wave should top out with Wave C expected to take out the June 2022 low of 3,636.87 with a timeframe for a bullish turn another year down the road during June 2023.
[i] The Speedo Situation: Like wearing the famed swimwear, being short options isn’t right for everyone.
[ii] The Benjamin Franklin Fish Similarity tells us, “Like guests and fish, markets start to stink after three months (days, weeks, etc.) of moving against the trend.”
More Stock Market News from Barchart

/Nvidia%20logo%20by%20Konstantin%20Savusia%20via%20Shutterstock.jpg)

/Apple%20products%20on%20desk%20by%20Ake%20Ngiamsanguan%20via%20iStock.jpg)
/Eli%20Lilly%20%26%20Co_%20by%20Tada%20Images%20via%20Shutterstock.jpg)