
- US stock indexes moved into long-term downtrends this past January, extending the break through the June lows.
- While all three could rally through September, the expectation is new lows will be hit yet this year.
- So far, the Nasdaq has led both the S&P 500 and DJIA, both on during the selloff and recent rally.
Have the long-term downtrends in the S&P 500, Dow Jones Industrial Average, and Nasdaq come to an end? No. That was simple enough. See you next time.
What’s that? I should fill out my discussion a bit more? Got it. Thanks for the reminder.
Despite what the talking heads say on most financial shows, the three major US stock indexes did not magically return to long-term uptrends at the end of July. Sure, they all posted solid rallies to close out the month but using a loose interpretation of Elliott Wave Theory all three look to have moved into the second wave of their respective 3-wave downtrend patterns.

The S&P 500 ($INX) looks to have moved into Wave B (second wave) of its 3-wave major (long-term) downtrend. Wave A (first wave) looks to have bottomed out with the June low of 3,636.87 before the $INX posted an inside month during July. The upside target area for Wave B is between 4,216.76 and 4,410.05 (dotted red lines), the 50% and 67% retracement levels of Wave A that began with the bearish key reversal during January that included the high of 4,818.62. Once Wave B peaks and Wave C (third wave) begins it would be expected to take out the Wave A low. As for timing, if we apply the Franklin Fish Similarity (Like guests and fish, markets start to stink after three months against the trend) the $INX could close higher during August and September before turning down again this coming October. Historically, October is the month for the $INX to make important moves.
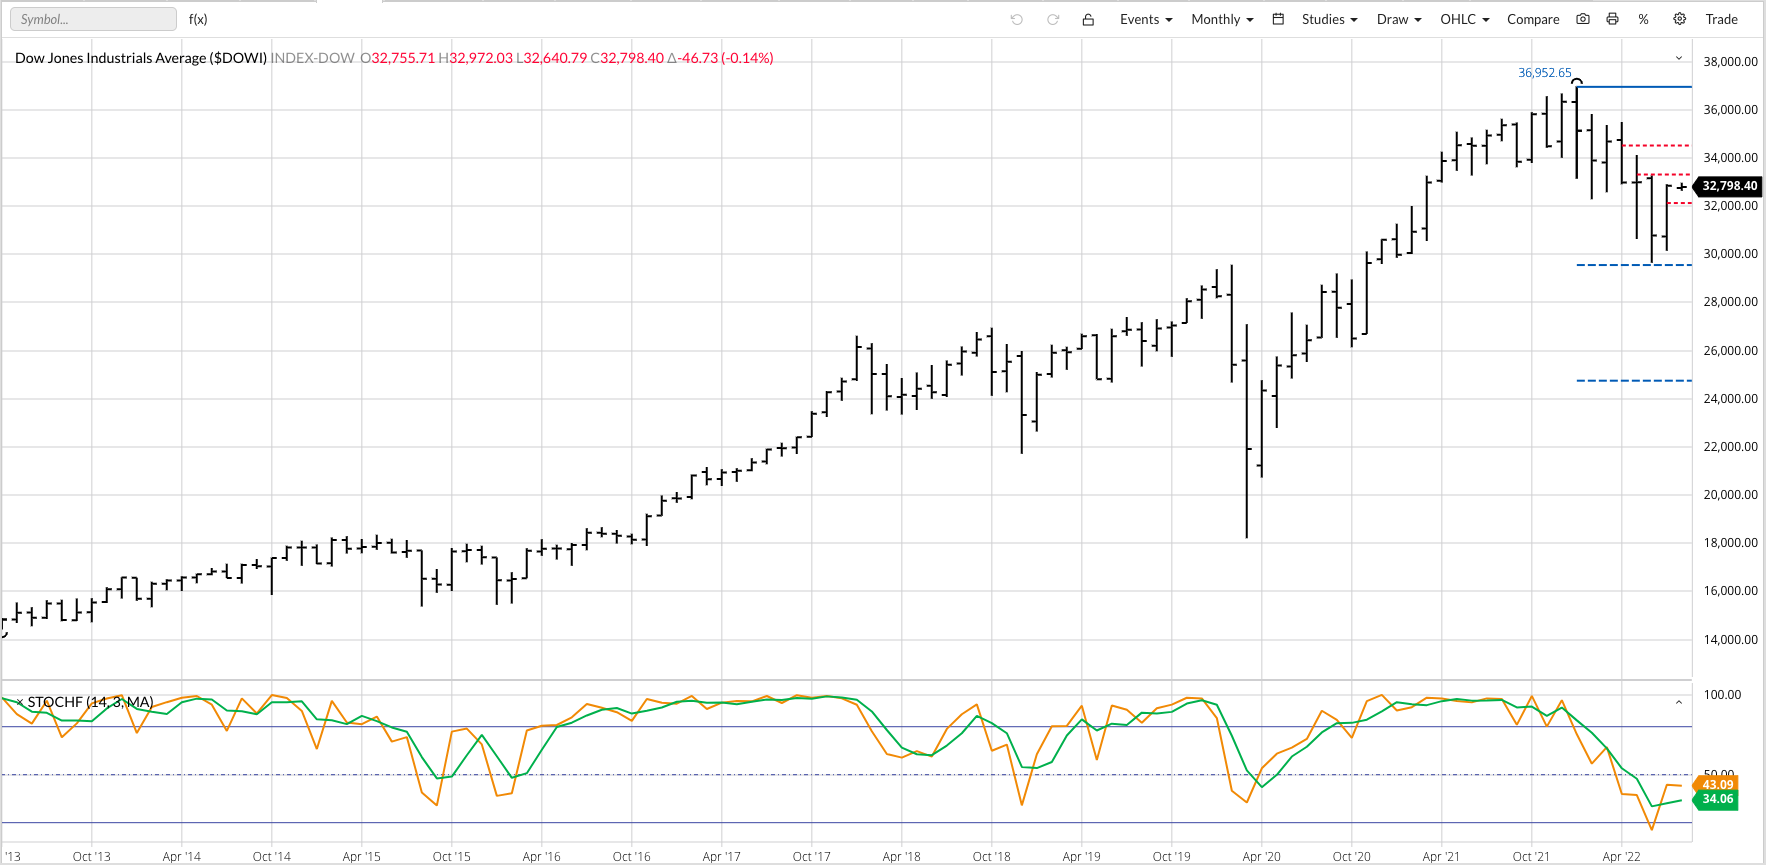
The Dow Jones Industrial Average ($DOWI) also looks to be moving into Wave B of its major downtrend. The $DOWI posted an inside range during July as it held above the June low of 29,653.29. The upside target area for Wave B is between 33,302.97 and 34,519.53 (dotted red lines), prices that mark the 50% and 67% retracement levels of the Wave A from the January high of 36,952.65 through the June. Note the January peak was part of a key bearish reversal pattern that told us the major trend had turned down. As with the S&P 500, once Wave B peaks and Wave C begins it would be expected to take out the Wave A low.
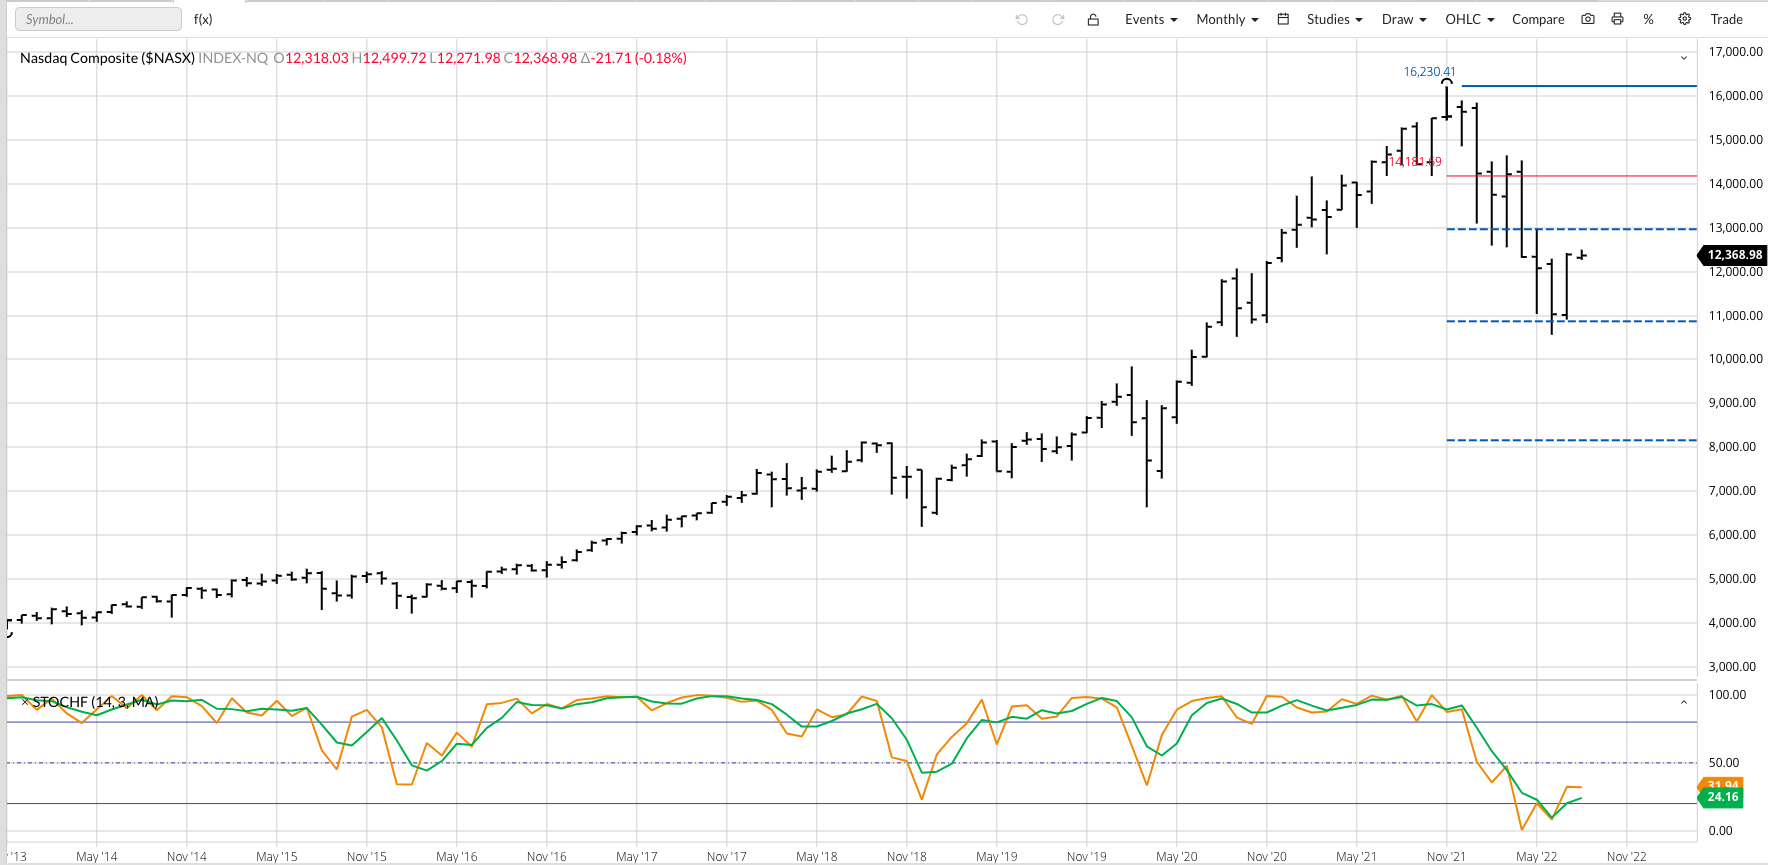
The Nasdaq ($NASX) is interesting in that it could be argued the index completed a bullish 2-month reversal pattern on its monthly chart, indicating its major trend has turned up. The $NASX has been leading the S&P 500 and Dow during this recent downtrend with the peak of the previous uptrend occurring during November 2021. Still, confirmation of a new downtrend did not occur to the $NASX posted a new 4-month low during January. Also note the $NASX has already erased 33% of its value (second dashed blue line) while both the $INX and $DOWI have held above their respective 20% levels (top dashed blue lines).
More Stock Market News from Barchart

/Micron%20Technology%20Inc_%20logo%20on%20building-by%20vzphotos%20vis%20iStock.jpg)


