
- The first half of 2022 was reportedly the poorest showing by US stock indexes in over 50 years.
- By the end of the day Thursday, June 30, some in the industry were starting to talk about the possibility of 50% selloffs ahead.
- The bottom line is all three major indexes continued to extend long-term downtrends that began this past January with clear bearish technical reversal patterns.
I found Thursday’s chatter about US stock indexes interesting, as it seems the majority has now concluded all three major markets could go down. Imagine that. If they had just taken the time to read my posts dating back to this past January, they might not have been quite so stunned by what happened the first half of 2022. According to some stories, the six months just ended was the worst (most bearish) showing by US stock indexes at a year’s midway point since 1970. That’s impressive. Made even more so when we consider that from a technical point of view the three major indexes are done yet.
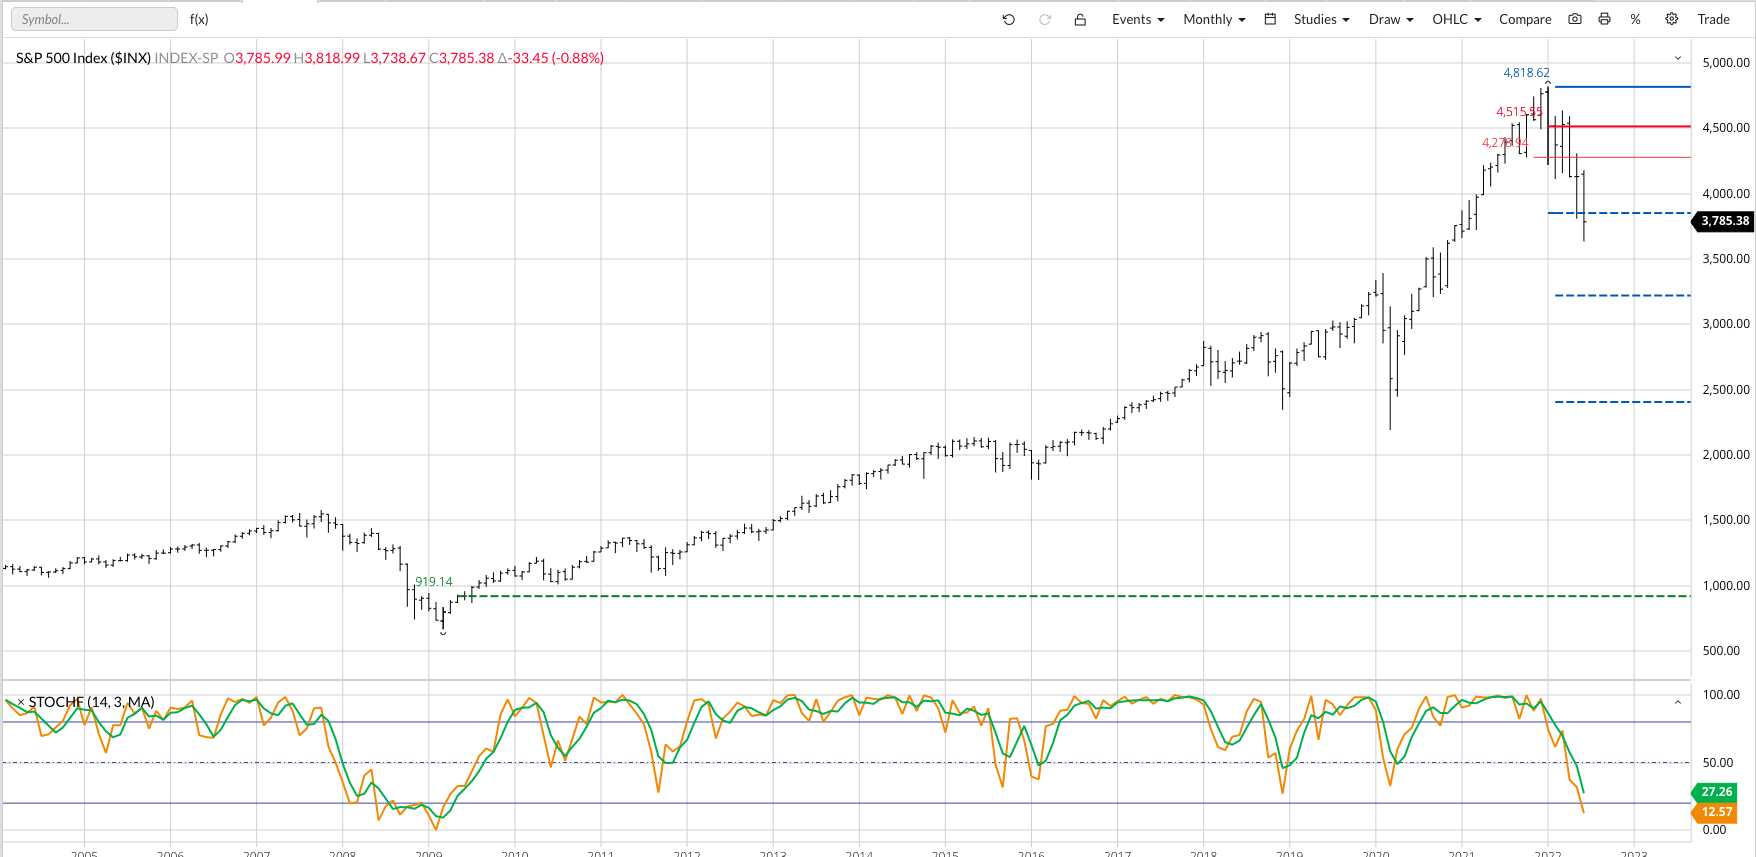
Starting with the S&P 500 ($INX), June saw a close of 3,785.38. This was down 21% from its high of 4,818.62 posted this past January, a mark that was part of the key bearish reversal that turned the long-term trend down. Naturally, the end of June found the $INX still within bear market territory marked by a 20% or greater drop from the high (top dashed blue line, roughly 3,854.90), with the next downside target the 33% selloff mark near 3,228.50 (middle dashed blue line). It was almost humorous to hear analysts now calling for a 50% selloff, putting the long-term target at 2,409.31 (bottom dashed blue line). I’m not convinced the $INX can get that low. Note monthly stochastics are quickly approaching the oversold level of 20%, with the last time this momentum indicator was below 20% being the late 2008/early 2009.

The Dow Jones Industrial Average ($DOWI) was a bit more resilient at 2022’s midpoint, holding above the 20% selloff mark at 29,592.12 (top dashed blue line). June saw the $DOWI post a low of 29,653.29 before closing back above 30,000. As with the S&P 500, the Dow’s monthly stochastics are nearing the oversold level of 20%, a technical factor that could – could – limit continued long-term selling interest. Another factor is more chatter of interest rates possibly topping by this time next year, though that still leaves the hold in the floor open for now.

A look at the monthly chart for the Nasdaq ($NASX) shows us a bit different picture. Like the $INX, the $NASX has cleared both it 20% and 33% selloff levels, with the 50% mark down near 8,106.10. However, monthly stochastics are already below the oversold 20% level meaning the index could, theoretically, start to find buying interest. I’m not going to be the first to jump into the pool but will certainly be keeping a close eye on its activity.
Could the three major indexes see their respective downtrends reach the 50% selloff marks? It’s possible, but not necessarily probable at this time. That being said I’m in no hurry get bulled up on any of the indexes, not until I see something that looks a bit more conclusive that a bottom is forming. After all, as I said before, I’m not that good at catching falling knives.
More Stock Market News from Barchart

/Micron%20Technology%20Inc_%20logo%20on%20building-by%20vzphotos%20vis%20iStock.jpg)


