
- The three major US stock indexes posted reversal pattern or confirmed reversals this past January, meaning all three had moved into long-term downtrends.
- Since then, much of the talk has been of picking bottoms, though monthly charts for all three look more like falling knives than a “bottoming process”.
- When it comes to catching a falling knife, the great Bob Ueker's advice on catching a knuckleball comes to mind.
One of the silliest questions I’ve heard today (one doesn’t have to go back too far to recall wild queries) was on the early morning Worldwide Exchange program on CNBC. The conversation was about the meltdown in US stock indexes, naturally, with the fill-in host (Brian Sullivan must be on assignment or vacation) asking his guest, “Is this a bottoming process?”

Let’s take a look at the monthly chart for the S&P 500 ($INX), shall we? If a sane person were to look at this chart, would the first thing that came to mind be, “This is a bottoming process”? I would have to say “no”. The $INX moved below its 20% retracement level near 3,855 (top dashed blue line) during May, hitting a monthly low of 3,810. Yes, the index rallied to close out the month but by mid-June has already established a new 4-month low and sits below 3,800 at this writing. That’s not a “bottoming process”, at least not at this point. It could still post a 2-month reversal but would need to finish this month in position territory and near the monthly high. As of this writing, the more likely scenario is the $INX falls to its 33% retracement (Dow Theory) near 3,228 (bottom dashed blue line).
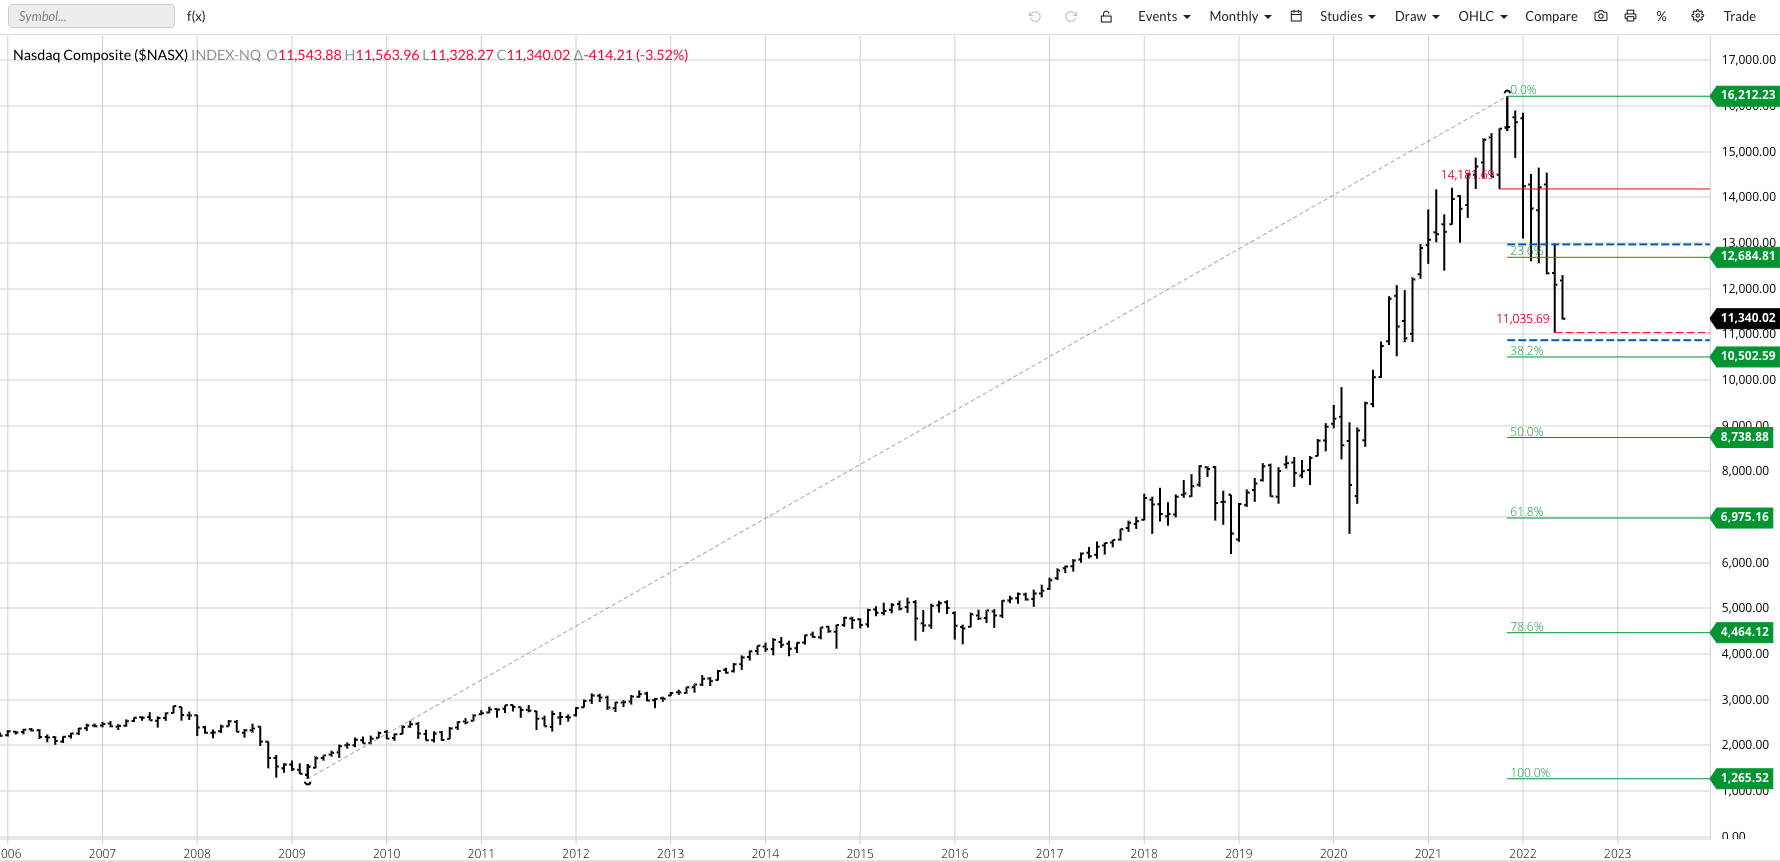
The Nasdaq ($NASX) is even deeper in bearish territory as it too posts a new 4-month low below 10,950 Monday morning. Here we see the $NASX quickly moving toward the 33% retracement level near 10,862 (bottom dashed blue line). If we squint our eyes just right we can imagine we see what looks to be a 3-wave major (long-term) downtrend (Elliott Wave Theory), though there still has not been a clear Wave 2 upturn. Unless we count this past February and March. Keep in mind this downtrend was confirmed with the new 4-month low this past January, the same time the S&P 500 and DJIA were posting bearish reversal patterns.
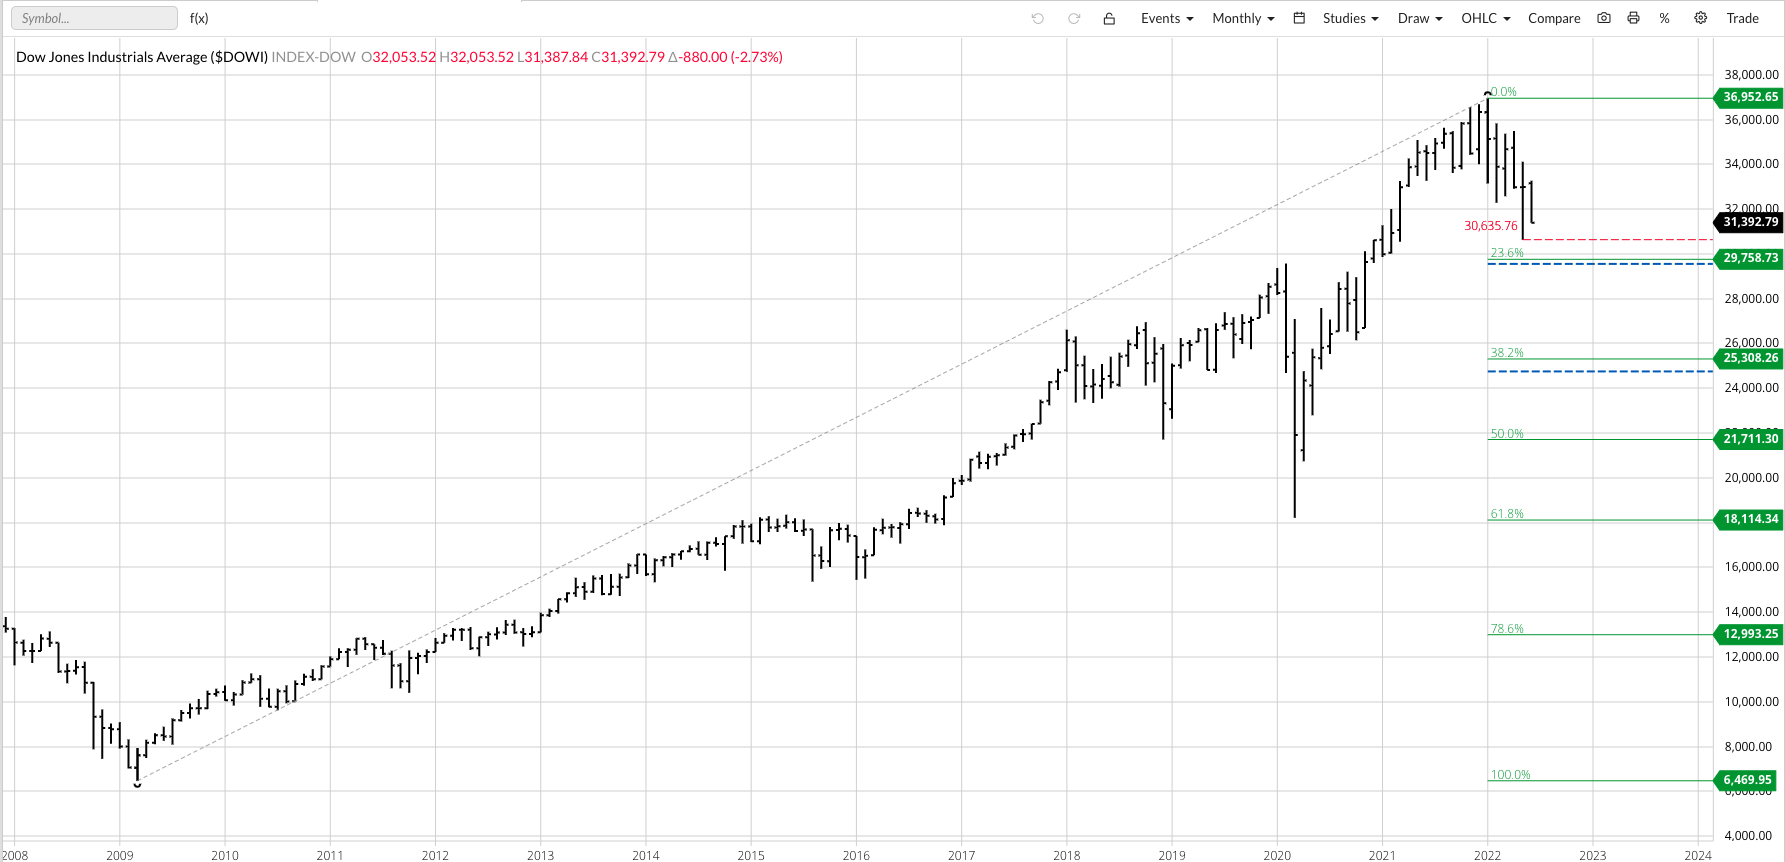
As for the DJIA ($DOWI), the break has been a bit more moderate. But it is a break nonetheless with no sign of a “bottoming process” to be seen on this chart. The bearish territory of a 20% decline is down near 29,562, with the May low reaching 30,636. However, June has already seen the $DOWI hit a new 4-month low near 30,610 meaning it wouldn’t take much to reach the 20% retracement level.
Rather than a “bottoming process”, I see a set of falling knives. And to paraphrase the great Bob Uecker (talking about catching a knuckleball in baseball), “The way to catch a ‘falling knife’ is to wait until it stops ‘falling’ then pick it up.” That’s the bottoming process I’m looking for.
/AI%20(artificial%20intelligence)/Hands%20of%20robot%20and%20human%20touching%20on%20big%20data%20network%20connection%20by%20PopTika%20via%20Shutterstock.jpg)

/Nvidia%20logo%20and%20sign%20on%20headquarters%20by%20Michael%20Vi%20via%20Shutterstock.jpg)

/Meta%20Platforms%20by%20Primakov%20via%20Shutterstock.jpg)