
- Though few are talking about in on financial television Tuesday morning, US stock market indexes posted incredibly bearish technical patterns during January.
- From a technical point of view the S&P 500, Dow, and Nasdaq all completed important reversal patterns at Monday's close, indicating investment money could continue to flow out of the sector.
- However, it's also possible global investors don't pay attention to technical patterns anymore, similar to how basic market fundamentals are ignored, lending credibility to the Random Walk Theory.
As a technical analyst, I can’t help but salivate at what I see on the long-term monthly charts of the S&P 500 index ($INX), the Dow Jones Industrial Average ($DOWI), and the Nasdaq ($NASX). From a purely technical point of view, all three posted important bearish technical reversals indicating their respective major (long-term) trends have turned down. By the time we get to the end of February, or possibly the end of the Q1 when March comes to a close, we should have a good idea to the eternal Trend vs. Random Walk debate.
For clarity, there are three basis schools of thought when it comes to market analysis: Fundamental (in stocks this means economic policy, earnings, etc.), Technical (the study of price direction over time, based on the idea all fundamentals are accounted for in price movement), and Random Walk (each day/week/month is independent of the previous and the following meaning markets move randomly, without clear patterns).
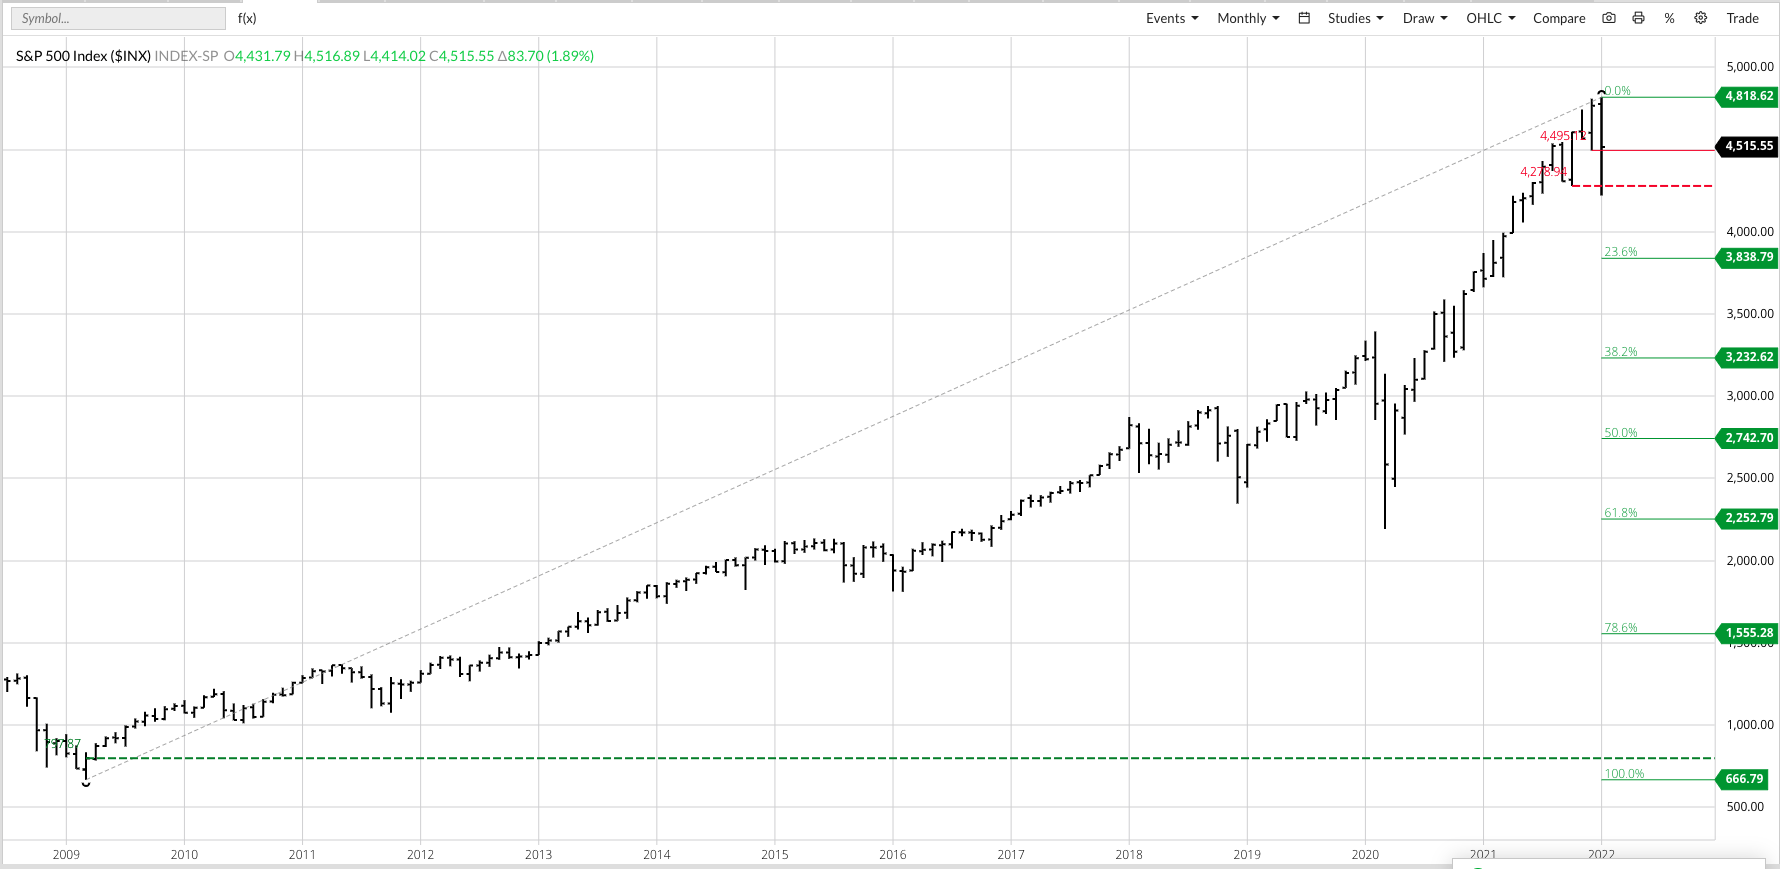
Let’s start with what happened in the S&P 500 during January. The $INX posted a new all-time high of 4,818.62 before falling below the December low of 4,495.12 and closing at 4,515.55, down 250.63 for the month. If there were nothing more to consider, from a technical standpoint, this is a classic example of a major key bearish reversal with a downtrend to follow. (A side note: There is a subset of classic technical analysts that say a market has to close below the previous month’s low for a bearish key reversal to be completed.) As the old infomercials used to always scream, though, “But wait, there’s more!” The January low also took out the previous 4-month low of 4,278.94 from last October. Therefore, even if traditionalists don’t want to recognize the clear bearish key reversal there is no denying the bearish 4-month reversal.
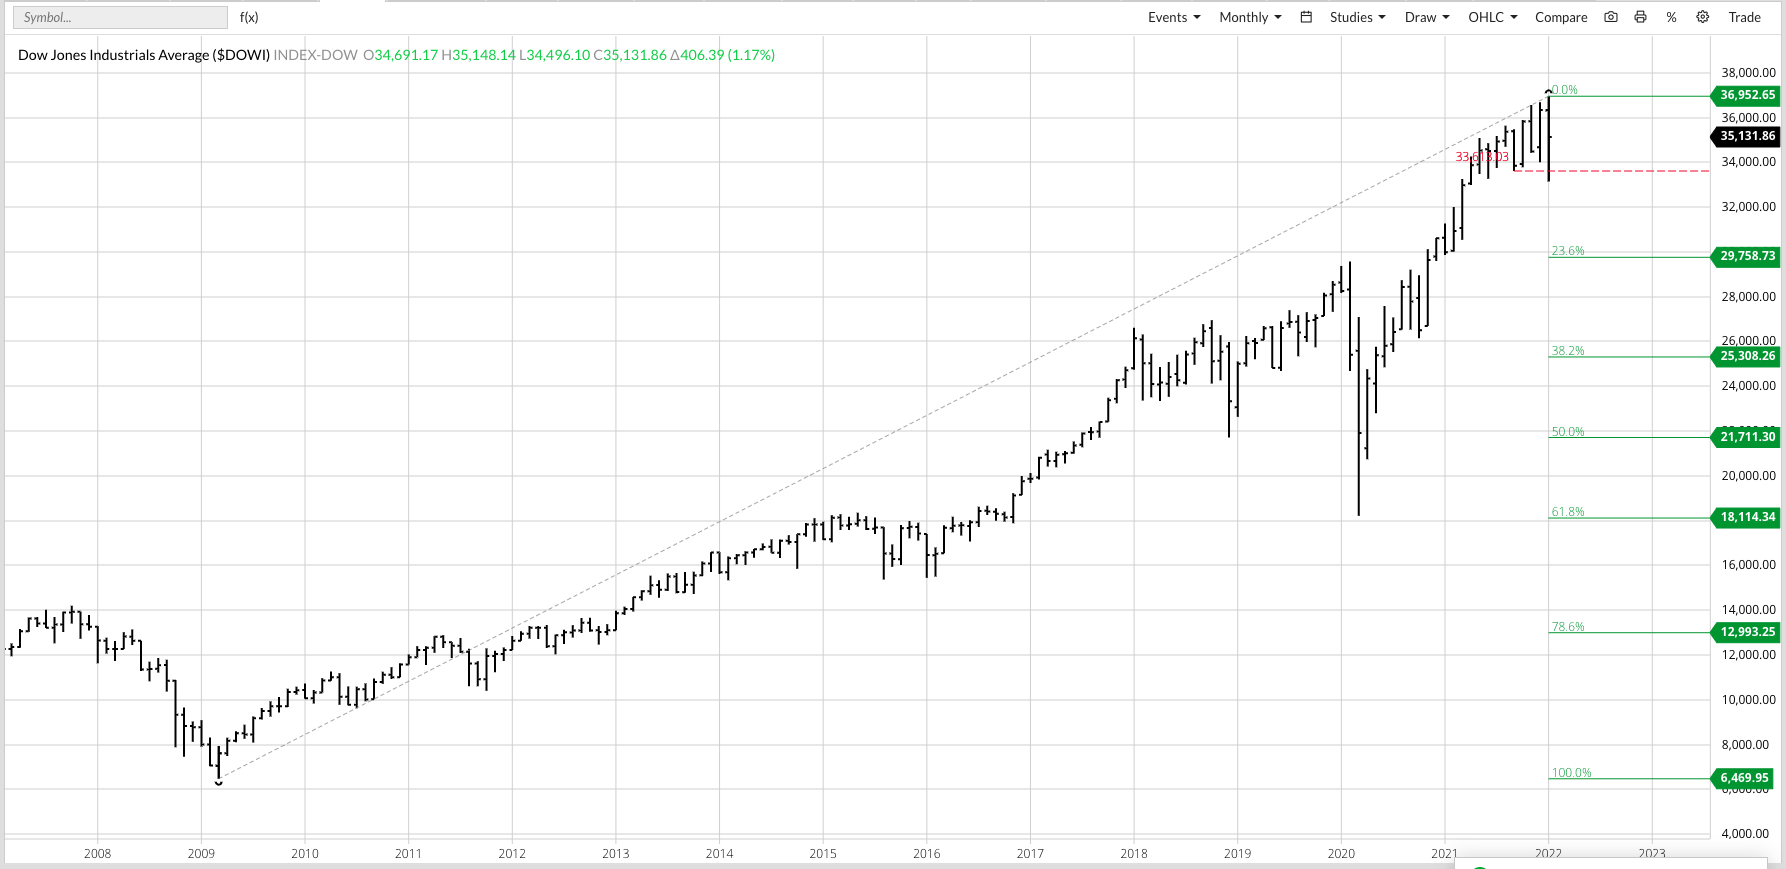
The monthly chart for the Dow shows us much the same thing as the $DOW posted a new high of 36,952.65 during January before taking out the previous 4-month low of 33,613.03. If we the simplest form of technical analysis, that being Dow Theory, we would expect a 33% selloff following the January reversal. But nothing in analysis is absolutely clear, with some (like me) using the starting point back at the low of 6,469.95 from March 2009 while others would argue the most recent uptrend started with the March 2020 low of 18,213.65. For now, I’m keeping an asterisk by that move. With that in mind, a 33% break puts a target near 26,790.00.
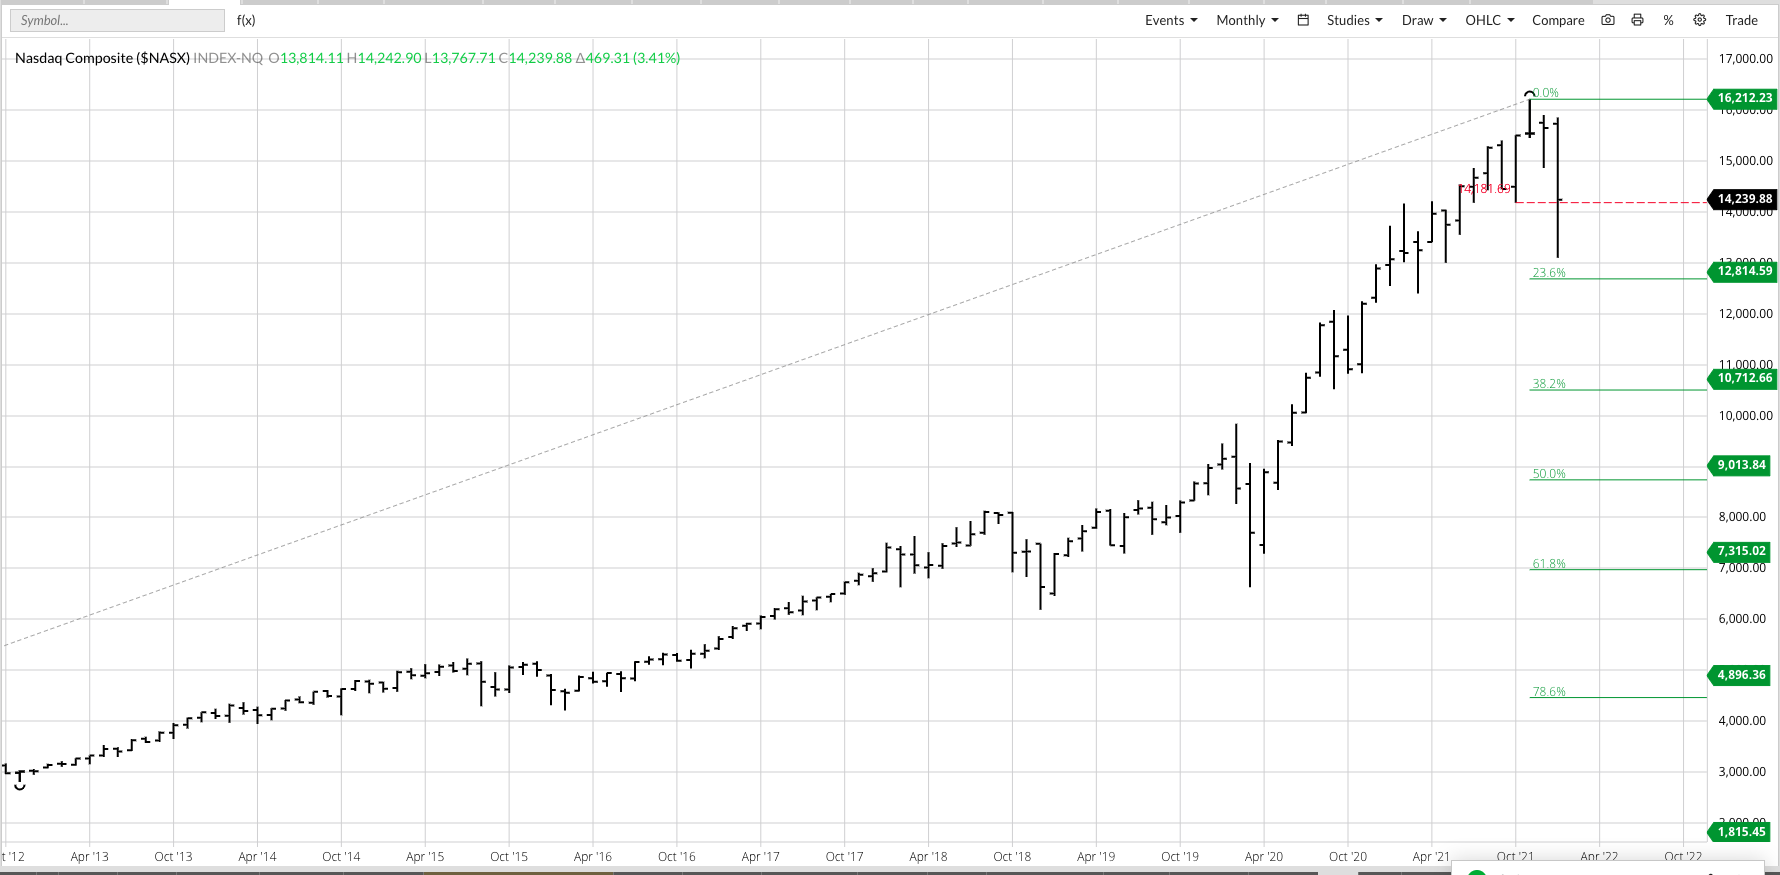
The monthly chart for the $NASX looks a bit different in that it did not post a new high during January. Instead, this tech index simply collapsed to start the year, hitting a low of 13,097.65, blowing through the previous 4-month low of 14,181.69 from last October. Like the others, though, the bottom line is a new 4-month low is still considered a reversal pattern, still viewed as a key momentum shift.
But will any of this matter? Will large global investors be chased out of stocks in general based on long-term technical patterns? If so, it opens the door to even more investment in fundamentally bullish commodity markets and sectors (e.g. oilseeds). If not, then the idea markets are just out for random walks gains new followers and investment money should continue to flow into stocks.
It will be fun to watch.

/AI%20(artificial%20intelligence)/3D%20Graphics%20Concept%20Big%20Data%20Center%20by%20Gorodenkoff%20via%20Shutterstock.jpg)
/Netflix%20on%20tv%20with%20remote%20by%20freestocks%20via%20Unsplash.jpg)

/Nvidia%20logo%20and%20sign%20on%20headquarters%20by%20Michael%20Vi%20via%20Shutterstock.jpg)
/NVIDIA%20Corp%20logo%20on%20phone-by%20Evolf%20via%20Shutterstock.jpg)