
In November 2021, the cryptocurrency asset class’s market cap rose for the first time above the $3 trillion level. On November 1, it was hovering just above the one trillion level. Cryptos have given new meaning to boom and bust over the past years. If history is a guide, the current consolidation period could give rise to the next explosive rally after the implosive price action that took Bitcoin and Ethereum from sky-high levels to the lowest prices in years.
Meanwhile, shares of crypto-related stocks and ETFs plunged with the tokens. The shares of Bitwise Crypto Industry Innovators ETF (BITQ) and Coinbase Global Inc. (COIN) stand to gain when the cryptos get back on a bullish path.
Bitcoin tanked
After reaching a record $68,906.48 in November 2021, Bitcoin ran out of upside steam, and price carnage ensued.

The chart highlights the decline that took the top cryptocurrency to a low of $17,614.34 in June 2022. Since the 74.4% drop, Bitcoin has traded in a range between the June low and $25,198.76. At around $20,400 on November 2, Bitcoin was near the middle of its trading range. The current consolidation period could be a positive, given Bitcoin’s price history.
Boom and bust in the leading crypto
Price implosions and explosions are nothing new for Bitcoin.
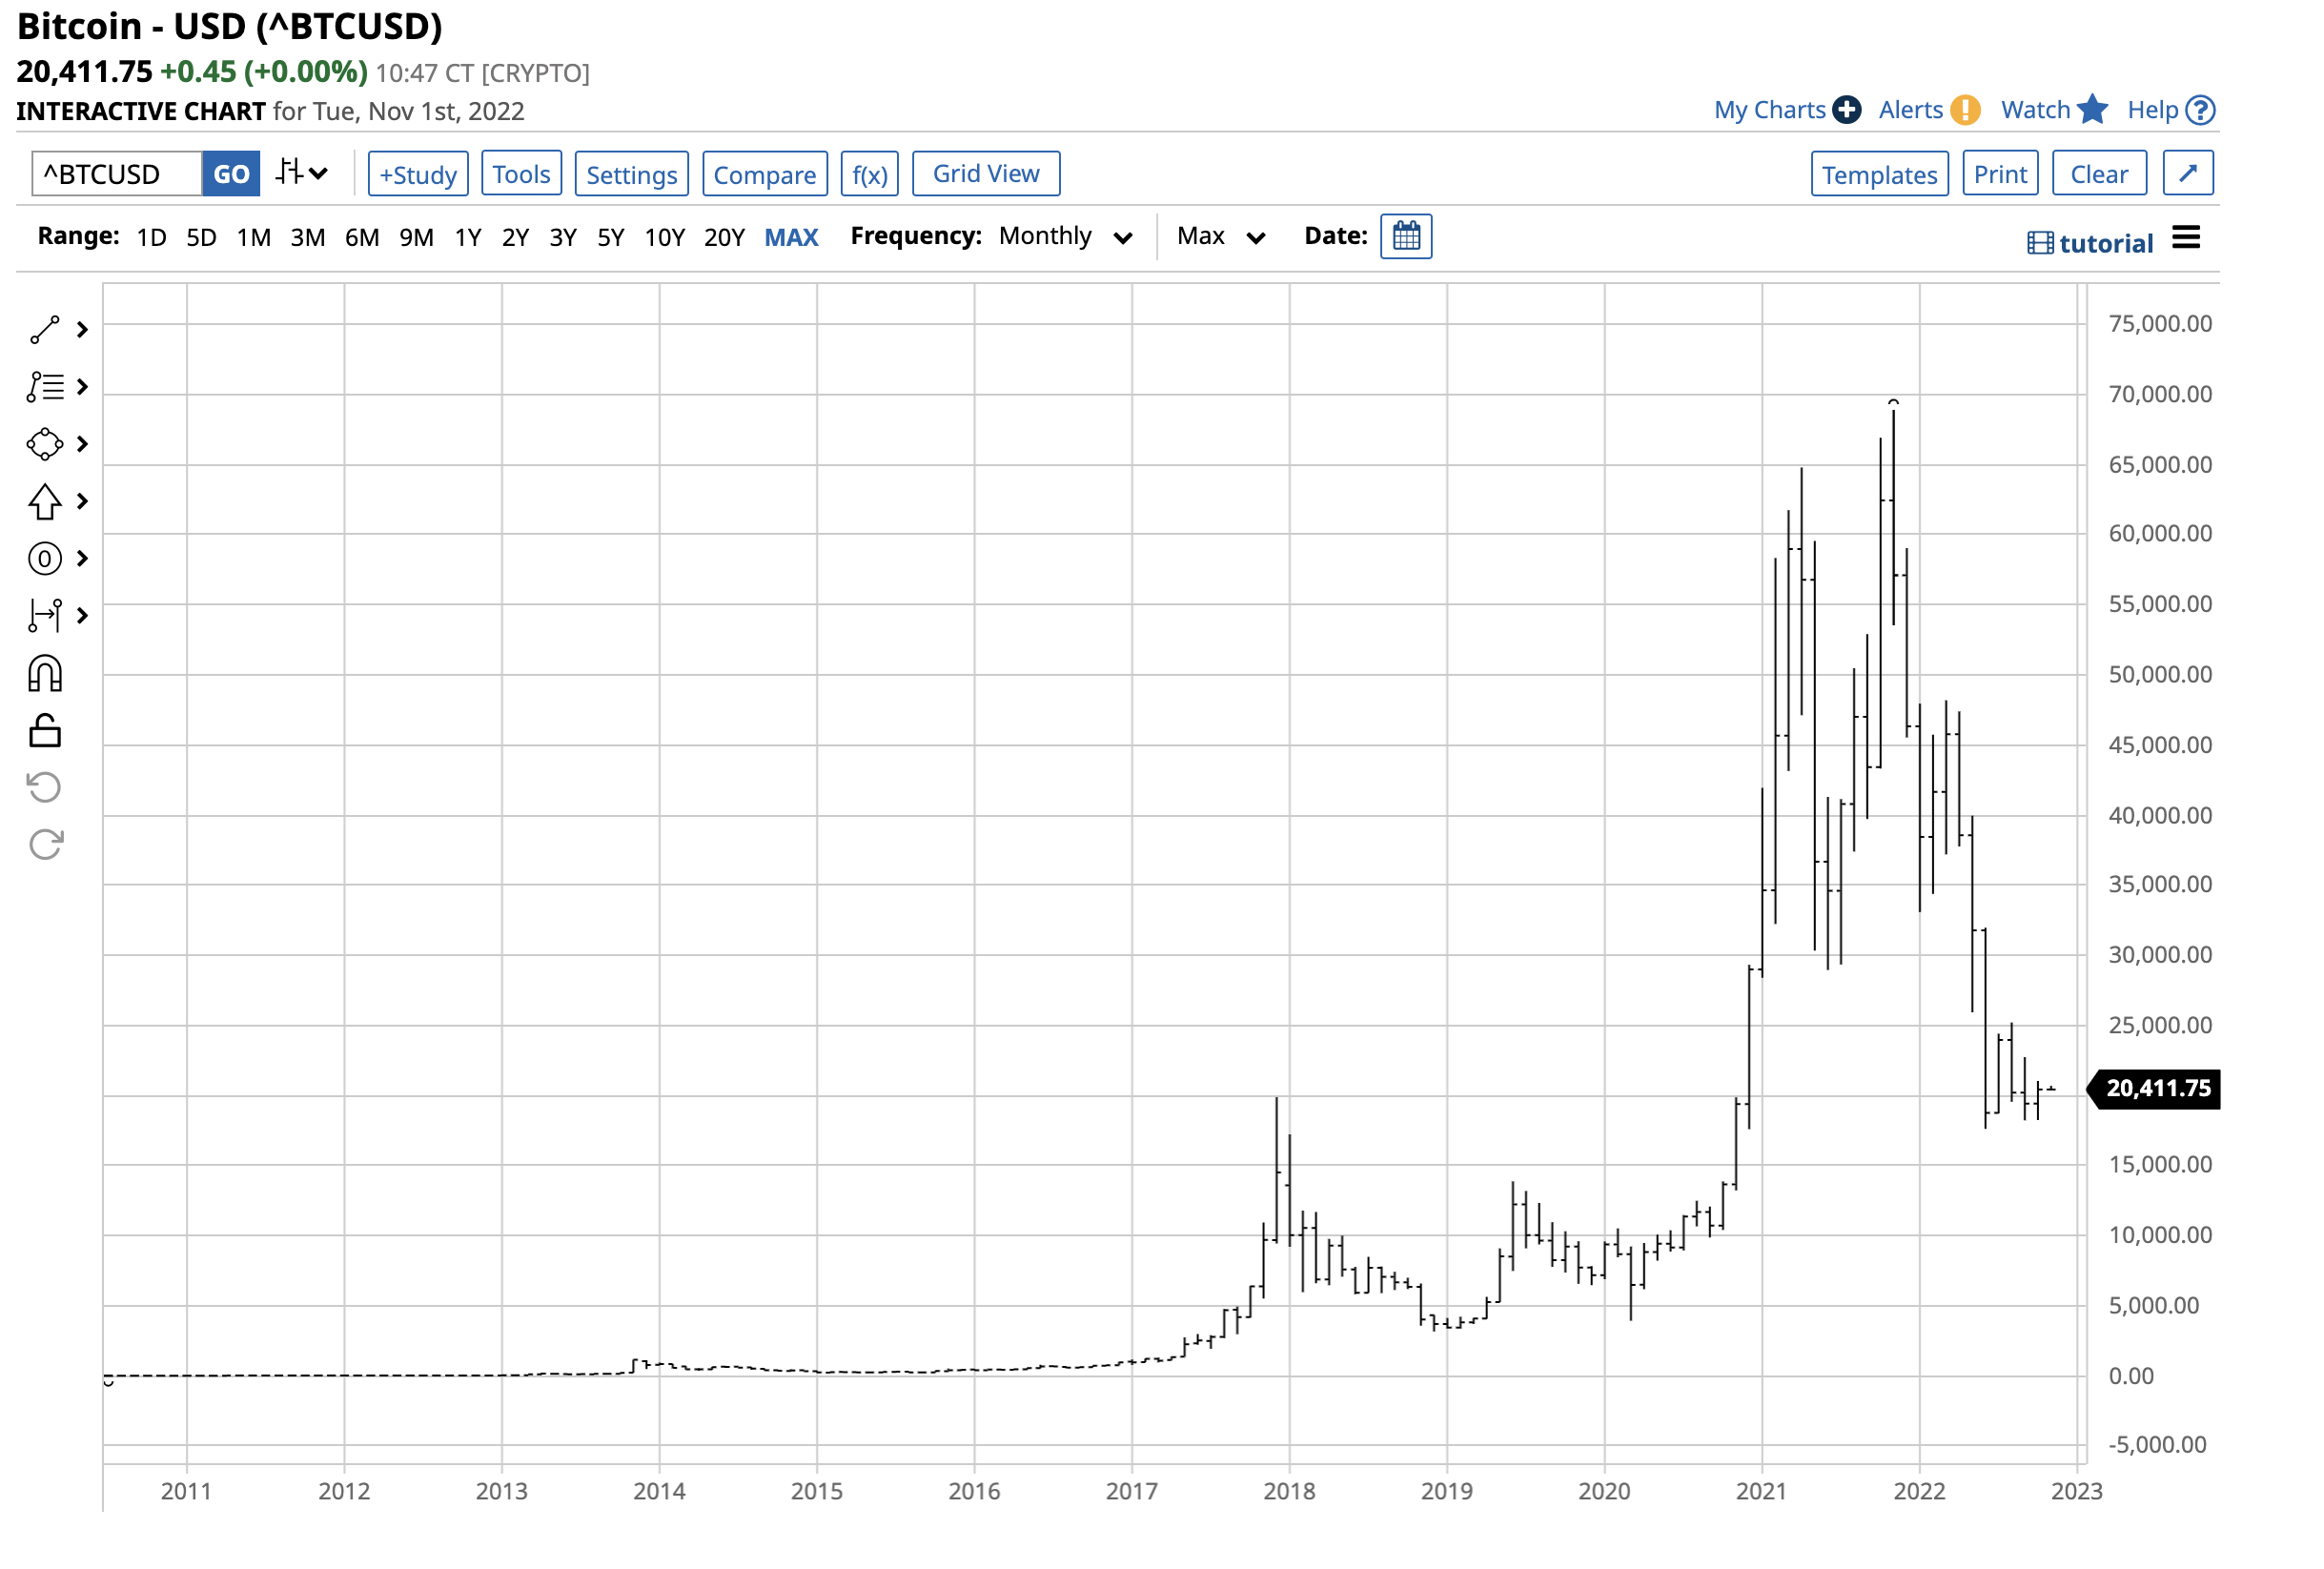
The long-term chart dating back to Bitcoin’s birth in 2010 shows that after reaching a high of $19,862 in December 2017, the price dropped 84% to $3,158.10 in December 2018. Bitcoin then rallied 338.4% to $13,844.30 in June 19 before declining 71.6% to $3,925.27 in March 2020. The rally that took Bitcoin to the November 2021 high was a 1,655% gain. Boom and bust price action is nothing new for the top cryptocurrency as it sits near the June 2022 low.
Ethereum follows the same volatile path
Ethereum reached its record high of $4,865.426 in November 2021.
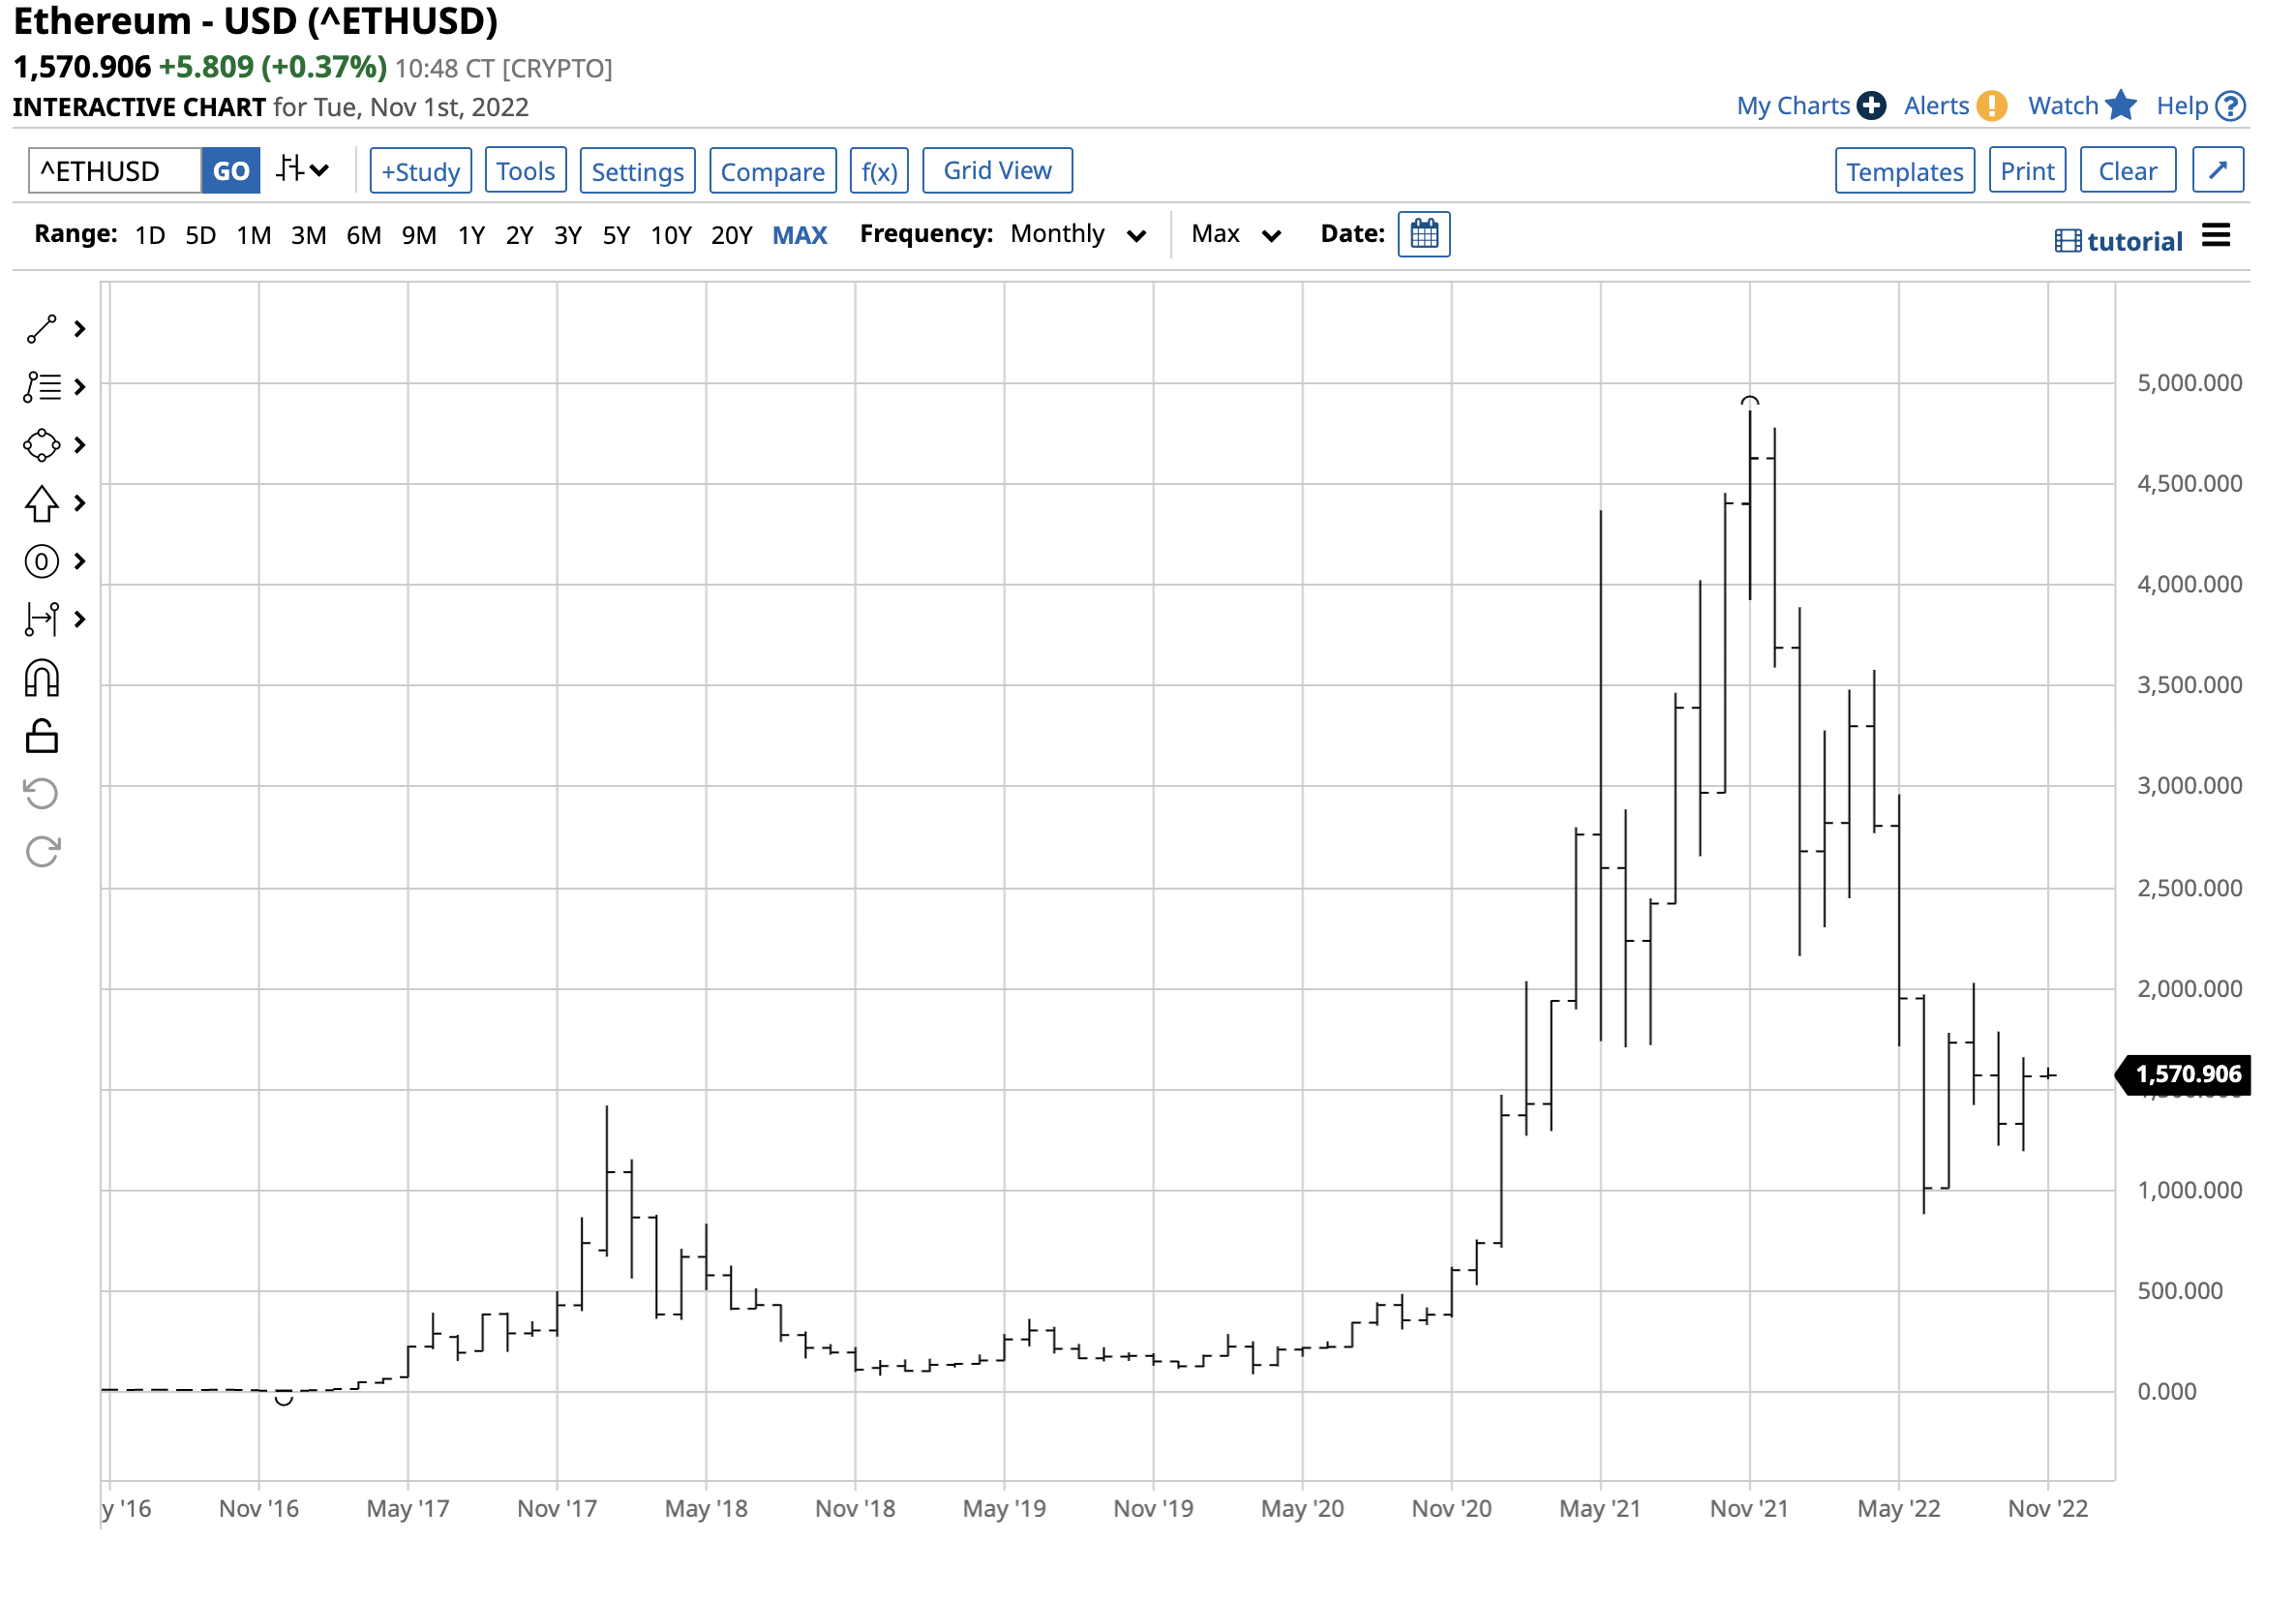
The long-term chart highlights the decline to $883.159 in June 2022, an 81.8% drop. Ethereum fell more than Bitcoin on a percentage basis from the late 2021 high to the June 2022 low.
In early 2018, Ethereum peaked at $1,419.975 and fell to $82.408 in December 2018, a 94.2% decline. By June 2019, the price reached $363.699 as Ethereum rose 341.3%. After falling to a slightly higher low of $89.505 in March 2020, Ethereum exploded to the November 2021 high, a 5,336% rally. While Bitcoin’s price action has gone from implosion to explosion, Ethereum volatility has been even higher on a percentage basis. At the $1,570 level on November 1, Ethereum was 77.8% higher than the June 2022 low. Bitcoin at the $20,400 level was up 15.8% from its most recent bottom, as Ethereum continues to exhibit a higher price variance level.
BITQ is Bitcoin soup
Bitcoin and Ethereum are assets that are not for the faint of heart. Trading cryptocurrencies are a financial rollercoaster that could only compare to riding a psychotic horse through a burning barn. Any market participant looking for action can find it in the burgeoning asset class.
The Bitwise Crypto Industry Innovators ETF (BITQ) is a new product that will likely move higher and lower with Bitcoin and Ethereum prices. At $6.13 per share, BITQ had $62.628 million in assets under management. The ETF trades an average of 130,554 shares daily and charges an 0.85% management fee. The top holdings include:
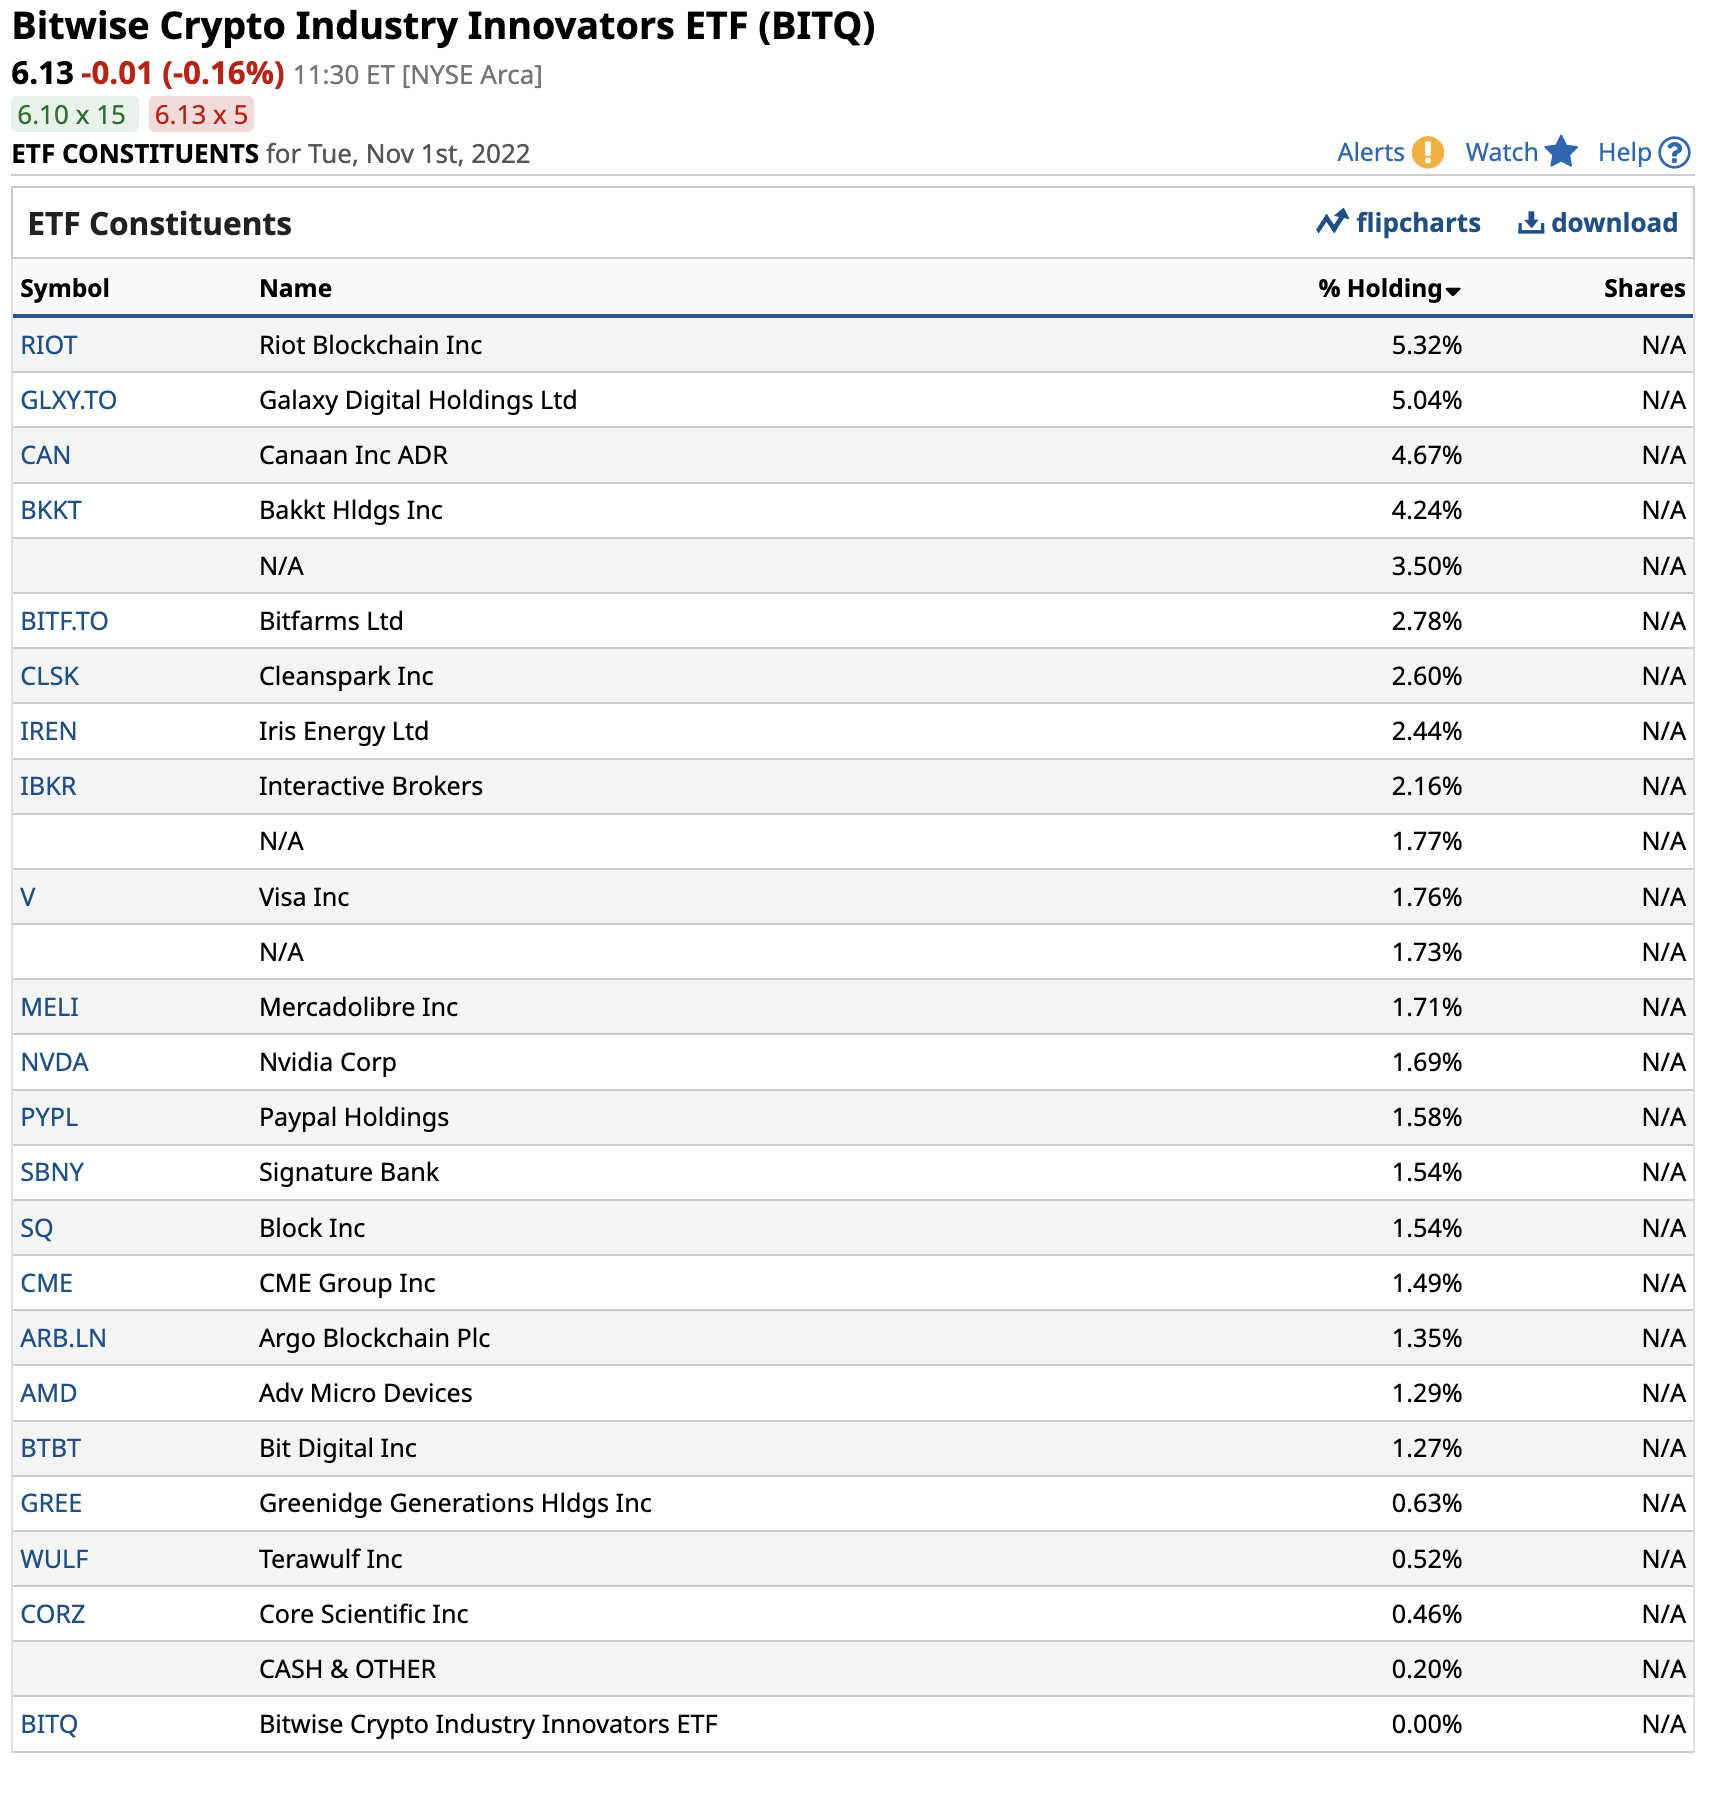
BITQ is Bitcoin soup as it owns shares of cryptocurrency-related companies.
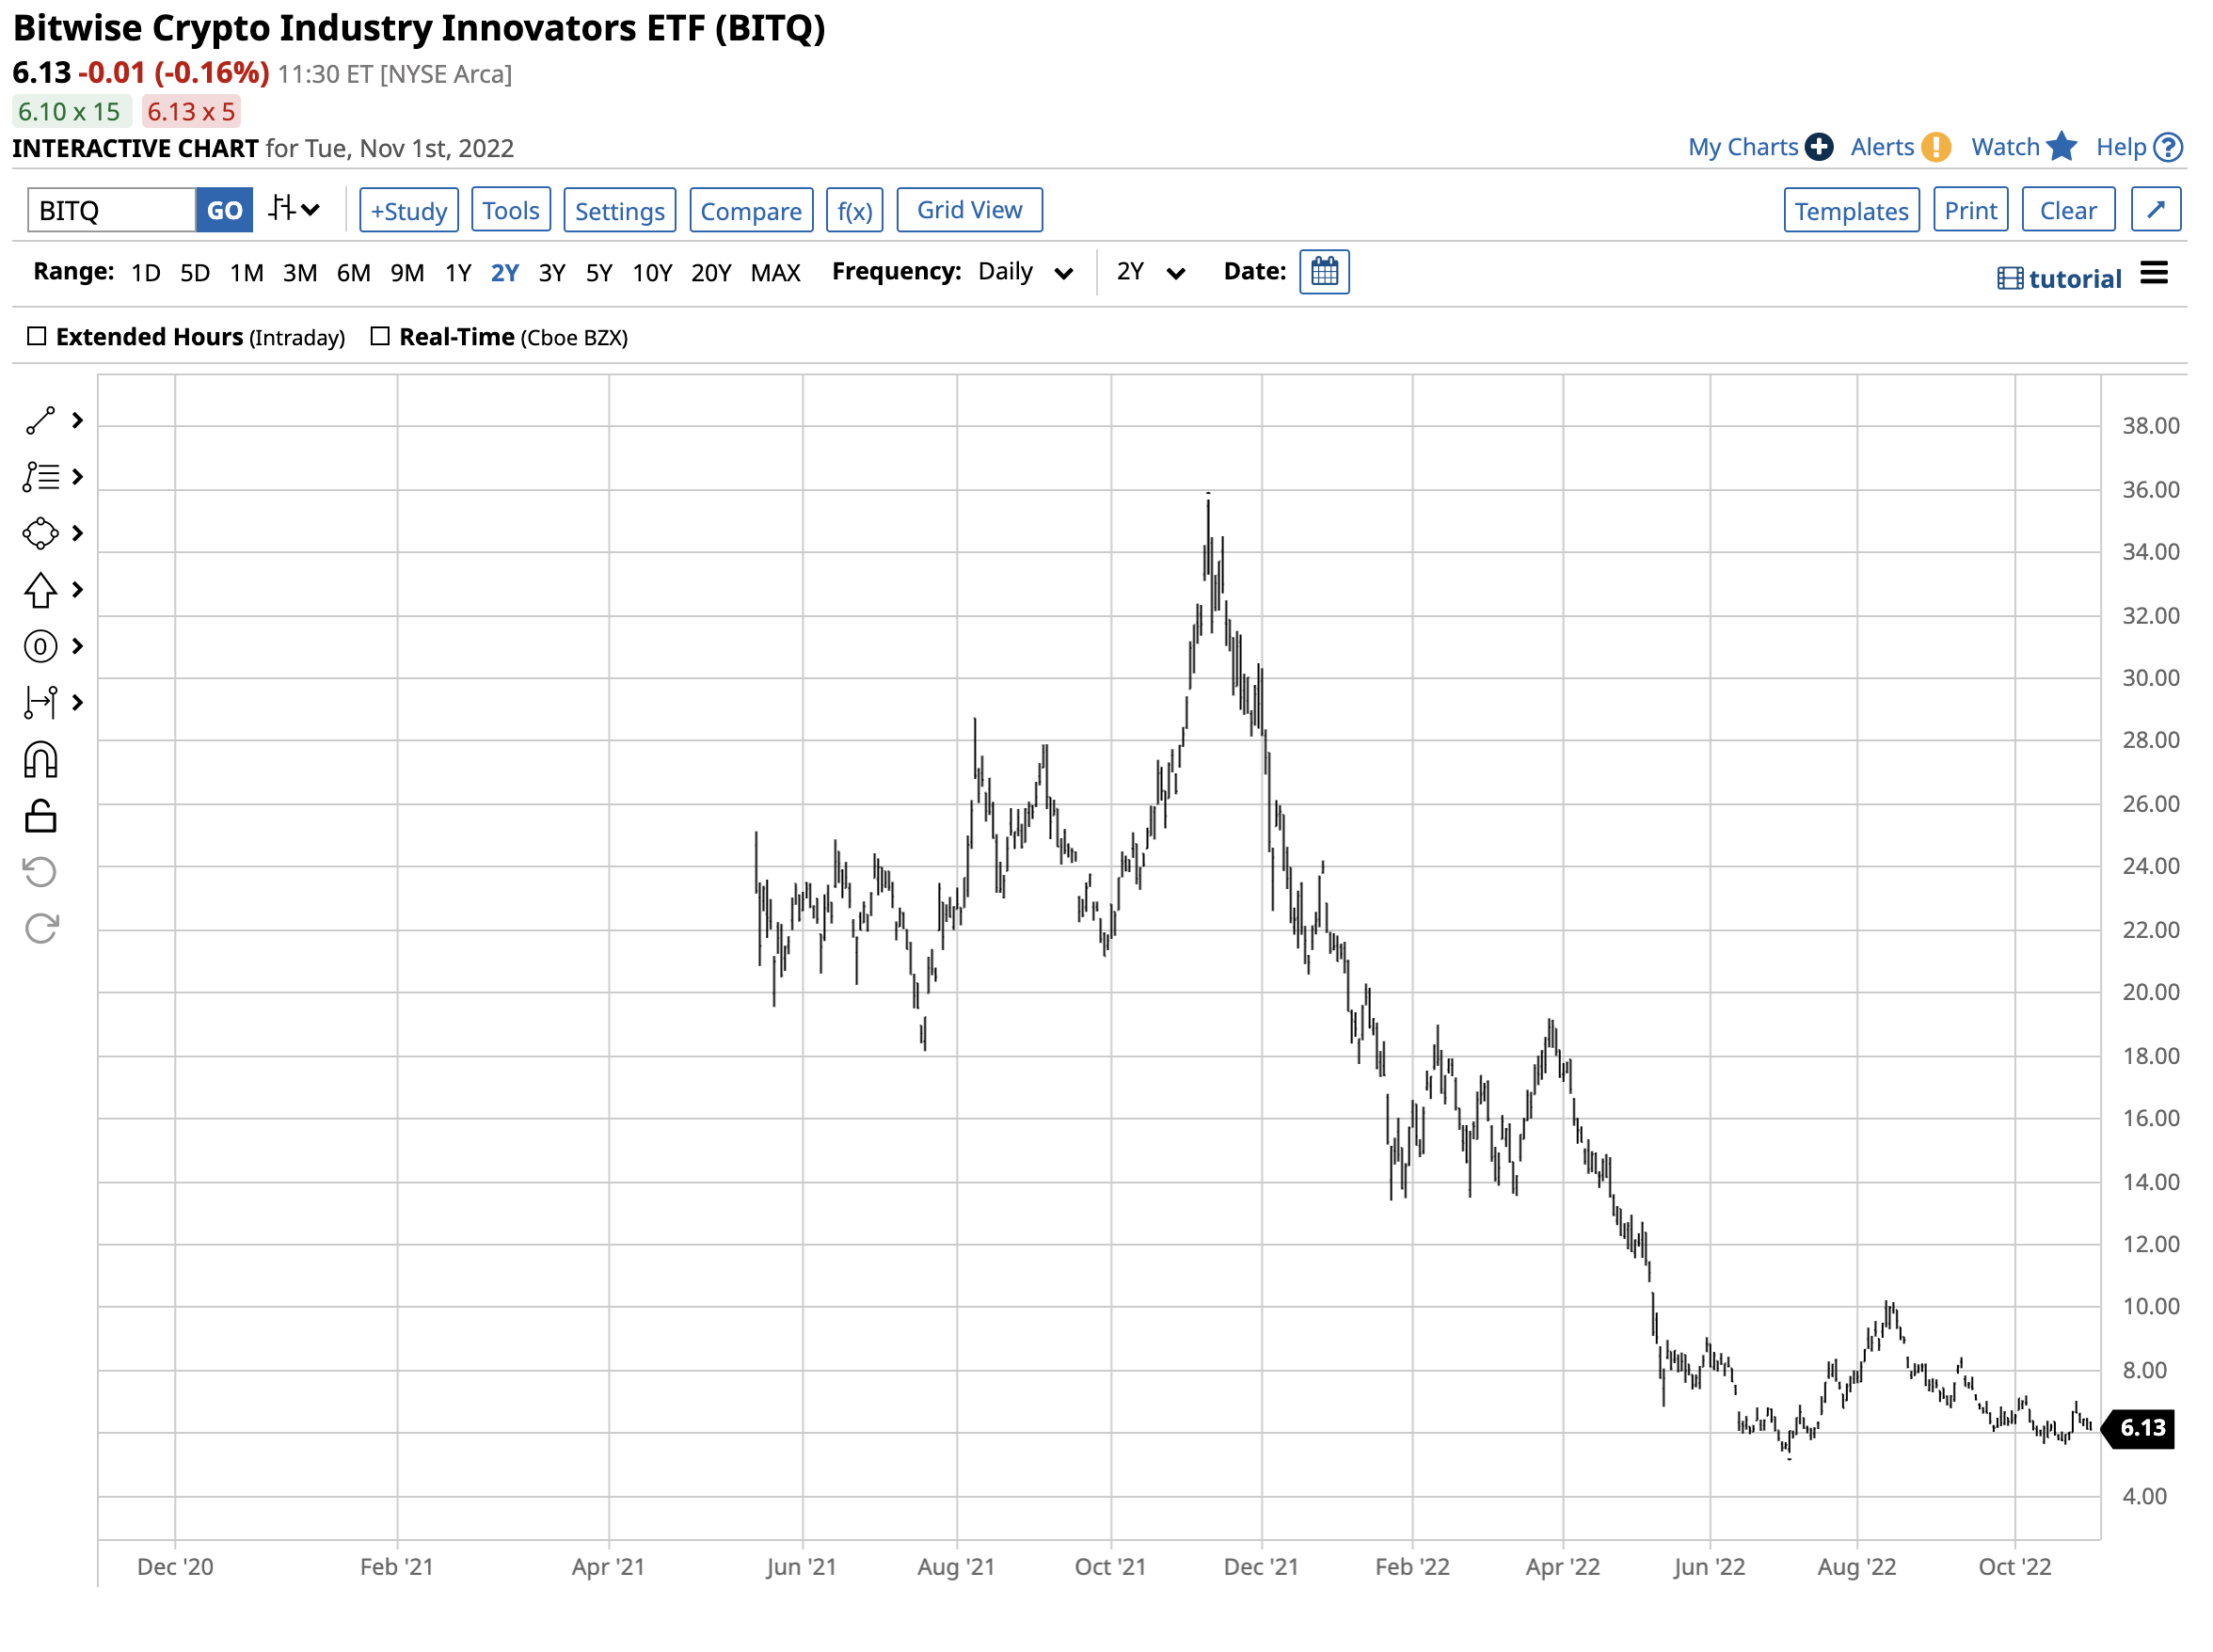
The chart shows BITQ rose to a high of $35.68 per share in November 2021 when Bitcoin and Ethereum prices peaked. It fell to $5.39 in early June, just after the leading cryptos reached the most recent lows, a decline of 84.9%. If the crypto winter gives way to another explosive rally, BITQ will likely soar.
COIN is the leading crypto platform
Coinbase Global Inc. (COIN) is the top cryptocurrency trading platform. At $65.08 per share on November 1, COIN’s market cap was above the $14.540 billion level. COIN trades an average of nearly eleven million shares daily. COIN’s all-time high came on its NASDAQ listing day when the shares reached $428.54. At that level, COIN’s market cap exceeded the value of the Chicago Mercantile Exchange (CME) and the Intercontinental Exchange (ICE), the two leading established asset trading platforms.

The chart illustrates COIN shares reached a lower high of $368.90 in November 2021 when Bitcoin and Ethereum peaked before falling to a low of $40.83 in May 2022, an 88.9% decline.
The most direct route for cryptocurrencies exposure is via the leading tokens, Bitcoin and Ethereum. Meanwhile, there were over 21,600 other cryptos to choose from, many of which are even more volatile than the leaders. Market participants looking for exposure to the asset class without holding cryptos in wallets or on platforms could choose the BITQ or COIN shares as they are likely to experience similar boom and bust action over the coming months and years. The price action since Bitcoin’s introduction in 2010, when it traded at five cents per token, suggests that the current bust will eventually transform into another boom period. However, only invest capital you are willing to lose, as cryptos will continue to be the wildest ride in the financial amusement park.
More Crypto News from Barchart
- Will a Possible Fed Pivot Boost Crypto Miner Marathon Digital (MARA)?
- Crypto Slumber- Buying the Dip with BITQ
- Options Traders Duke It Out Over This One Blockchain Stock
- Coinbase (COIN) Presents an Obvious Candidate for Unusual Options Activity


/Alphabet%20(Google)%20Image%20by%20Markus%20Mainka%20via%20Shutterstock.jpg)