As we approach the end of the 1st quarter of the year, the Nasdaq's price action is shaped by a transition from speculative hype to fundamental execution.
Macro-Term Price Drivers
The three primary macro forces currently driving the Nasdaq include:
- Monetary Policy Shift: Fed Chair Jerome Powell and other officials have indicated that after 75–175 basis points of easing since late 2024, the policy is now nearing or reaching a "neutral range"—a level that neither stimulates nor restrains the economy. While rate cuts have slowed, the current fed funds rate (3.50%–3.75%) provides a more stable liquidity environment compared to previous years.
- Fiscal Policy and Stimulus: Legislative actions, such as the One Big Beautiful Act (OBBBA), are providing significant tailwinds through retroactive corporate tax incentives and household tax refunds. These measures are expected to unlock corporate free cash flow and boost consumer liquidity throughout the first half of 2026. Remember how quickly money found its way back into the economy after the pandemic stimulus packages.
- AI Infrastructure Super-Cycle: Industry research forecasts that AI hyperscalers will spend at least $500 billion on infrastructure in 2026, with some estimates surpassing $650 billion to build out data centers and AI compute capabilities. AI has evolved from a trend into a structural driver, with AI infrastructure spending now accounting for a significant share of global GDP.
Intermediate-Term Upward Drivers
For the intermediate term, several factors are positioned to push prices higher:
- Double-Digit Earnings Growth: Analysts predict roughly 14%–15% growth for the S&P 500, with some projecting even higher growth in specific tech sectors, such as a projected 33% gain for technology in 2026. This sustained growth is increasingly driven by "operating leverage," in which AI-driven efficiency gains begin to translate into actual bottom-line profits.
- Market Breadth Expansion: While mega-cap tech remains dominant, there is a notable "rotation" where industrial and cyclical sectors are beginning to participate in the rally. This broadening participation is seen as a sign of a healthier, more durable bull market. As the spread between the SPY (weighted) and RSP (balanced) ETFs narrows, it confirms broader participation.
- Post-Correction "Buy-the-Dip" Opportunities: Many analysts, including those from Goldman Sachs and Morgan Stanley, expect 10%–20% corrections to be "likely" in 2026, often viewing them as opportunities to purchase stocks at a discount, rather than signals to exit. Analysts anticipate that these pullbacks will likely be met by significant institutional and retail buying. Record-high levels of corporate buybacks and M&A activity support this resilience.
Technical Picture
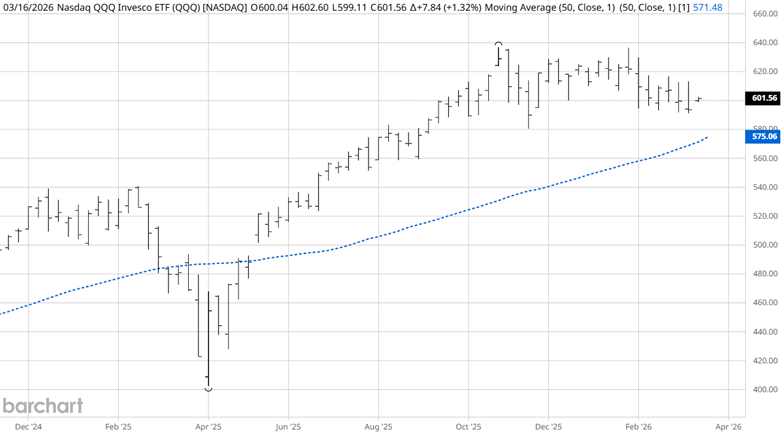
Source: Barchart
Since the most recent significant pullback in the Nasdaq QQQ ETF in April 2025, the market has rallied to an all-time high in October 2025. Then, turning into a sideways market beginning in 2026, as profit-taking set in. The weekly QQQ chart above shows the 50-day simple moving average (SMA) rising amid sideways price action. Will this area soon become the springboard to begin the next wave up in the Nasdaq market?
Seasonal Pattern
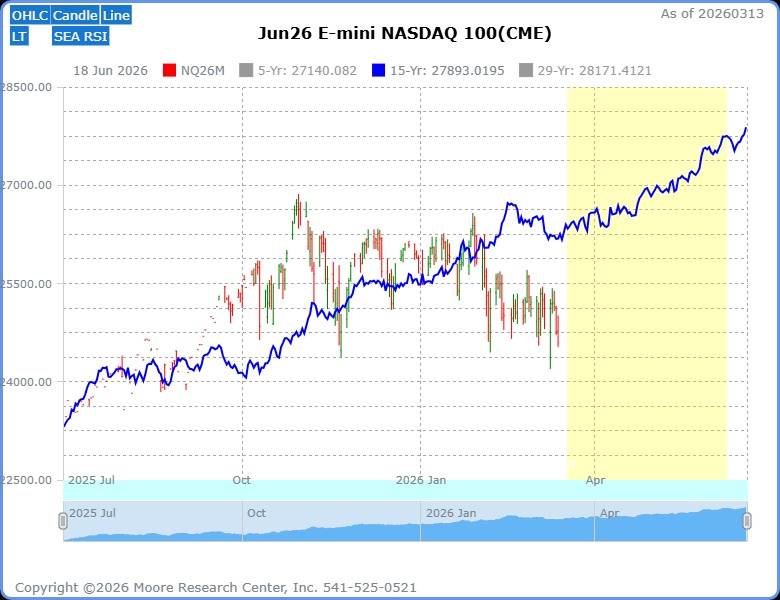
Source: Moore Research Center, Inc. (MRCI)
Immediately after the all-time high in October, the QQQ quickly corrected about 8.8%. And has since spent time trading between the all-time high and the low of the correction. MRCI research has identified a 15-year seasonal pattern (blue line) that has rallied in the past. The optimal seasonal buy window (yellow box) reveals that the Nasdaq 100 mini June futures contract has closed higher on about June 08 than on March 18 for 13 of the past 15 years, an 87% occurrence. During this period, MRCI hypothetical testing showed the average profit per mini-Nasdaq futures contract was 511.9, or $10,237.67. The duration of this seasonal window is rather long at 83 calendar days. Allowing longer-term traders to build a core position throughout the window. Or allow shorter-term traders to trade in and out of the market with a bullish bias.
As a crucial reminder, while seasonal patterns can provide valuable insights, they should not be the basis for trading decisions. Traders must consider various technical and fundamental indicators, risk management strategies, and market conditions to make informed, balanced trading decisions.
Assets to Trade the Nasdaq Market
- Standard Size Futures: Nasdaq-100 futures (NQ), traded on CME, contract size $20 x Nasdaq-100 Index.
- Micro Size Futures: Micro E-mini Nasdaq-100 futures (NM), traded on CME, contract size $2 x Nasdaq-100 Index.
- ETFs: Invesco QQQ Trust (QQQ), tracks the Nasdaq-100 Index; leveraged ETFs like ProShares UltraPro QQQ (TQQQ) or inverse ETFs like ProShares Short QQQ (PSQ).
- Options: Options on Nasdaq-100 futures (NQ), Micro E-mini Nasdaq-100 futures (NM), or ETFs like QQQ.
- Individual Stocks (Closely Correlated): Stocks like Apple (AAPL), Microsoft (MSFT), Amazon (AMZN), Nvidia (NVDA), and Meta (META), which are heavily weighted in the Nasdaq-100 (combined weight approximately~40%)
In closing…
The Nasdaq isn't just coasting on leftover hype anymore—it's being powered by some pretty solid fundamentals that feel built to last. You've got monetary policy settling into a neutral zone that keeps things liquid without going overboard, massive fiscal boosts from things like the OBBBA pumping cash back into companies and consumers, and that monster AI infrastructure build-out that's set to dump $500–650 billion into data centers and compute this year alone.
On top of that, double-digit earnings growth is kicking in (especially where AI efficiency finally hits the bottom line), breadth is finally spreading beyond the mega-caps, and the market's shown it loves to buy those 10–20% dips hard.
Against this backdrop, the seasonal pattern MRCI has tracked over the last 15 years stands out as a real opportunity. With an 87% win rate from mid-March into early June, and solid average gains on the mini futures, this window lines up perfectly for traders to lean bullish—whether you're scaling into a longer-term core position or swinging the moves with a positive bias.
Of course, no pattern is foolproof, and you've still got to layer in your own technicals, risk controls, and real-time market reads. But when the big-picture drivers are this constructive and history shows a reliable spring lift in this exact period, it feels like one of those setups worth paying close attention to. The next leg higher could be getting ready to kick off—don't sleep on it.
On the date of publication, Don Dawson did not have (either directly or indirectly) positions in any of the securities mentioned in this article. All information and data in this article is solely for informational purposes. For more information please view the Barchart Disclosure Policy here.


/A%20close-up%20of%20a%20General%20Motors%20corporate%20sign%20by%20lindaparton%20via%20Adobe%20Stock.jpeg)
/Delta%20Air%20Lines%2C%20Inc_%20passanger%20plane-by%20viper-zero%20via%20iStock.jpg)