When it comes to cruise stocks, the "Big 3" — Carnival (CCL), Norwegian (NCLH), and Royal Caribbean (RCL) — have balance sheets that look stronger than they have in years. But their technical charts are starting to feel like sinking ships.
What’s Happening With the Big 3 Cruise Stocks?
The cruise sector is entering 2026 with record bookings, but the stocks aren’t looking quite as optimistic. This is because the market is shifting its focus from revenue to margins and regulatory headwinds.
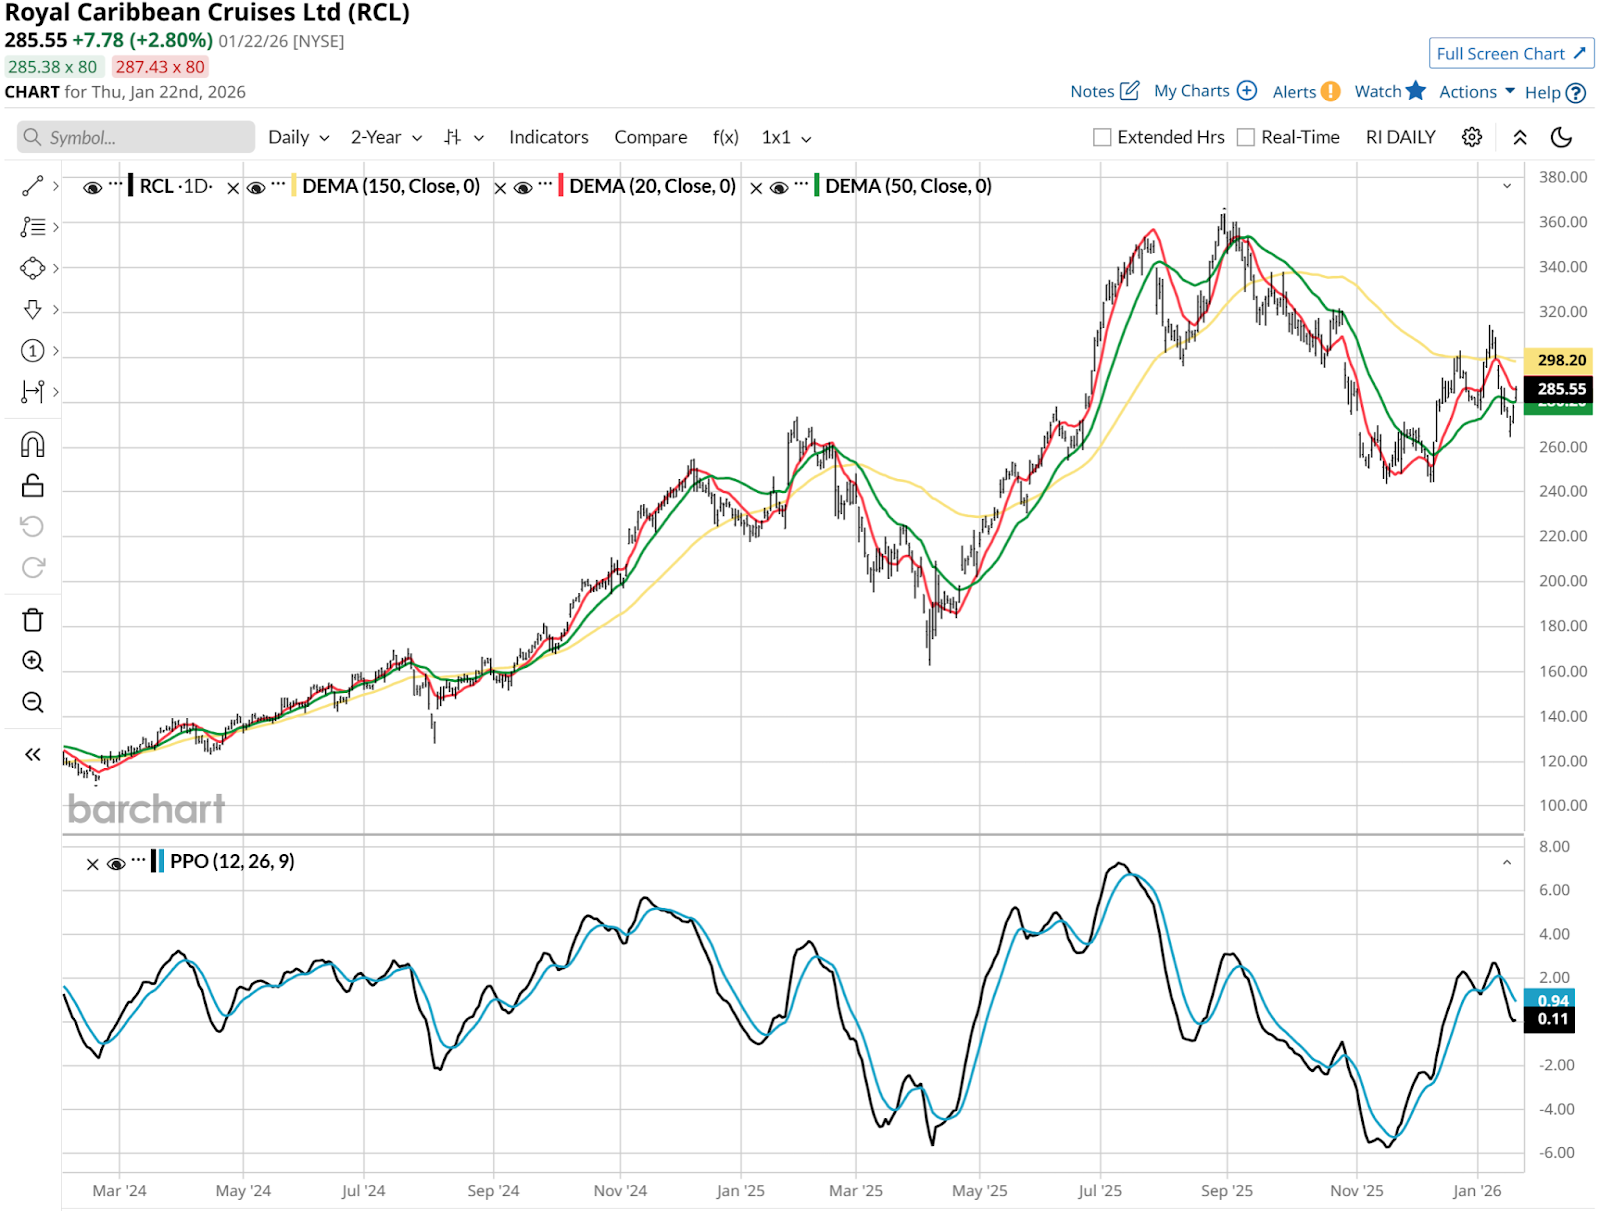
Let’s take a look at Royal Caribbean — the mainstay of the group. RCL has dramatically outpaced peers with its strategy of stratifying across several levels of ships to accommodate differently sized budgets. The company is targeting 20% earnings per share (EPS) growth. But maybe that’s all priced in.
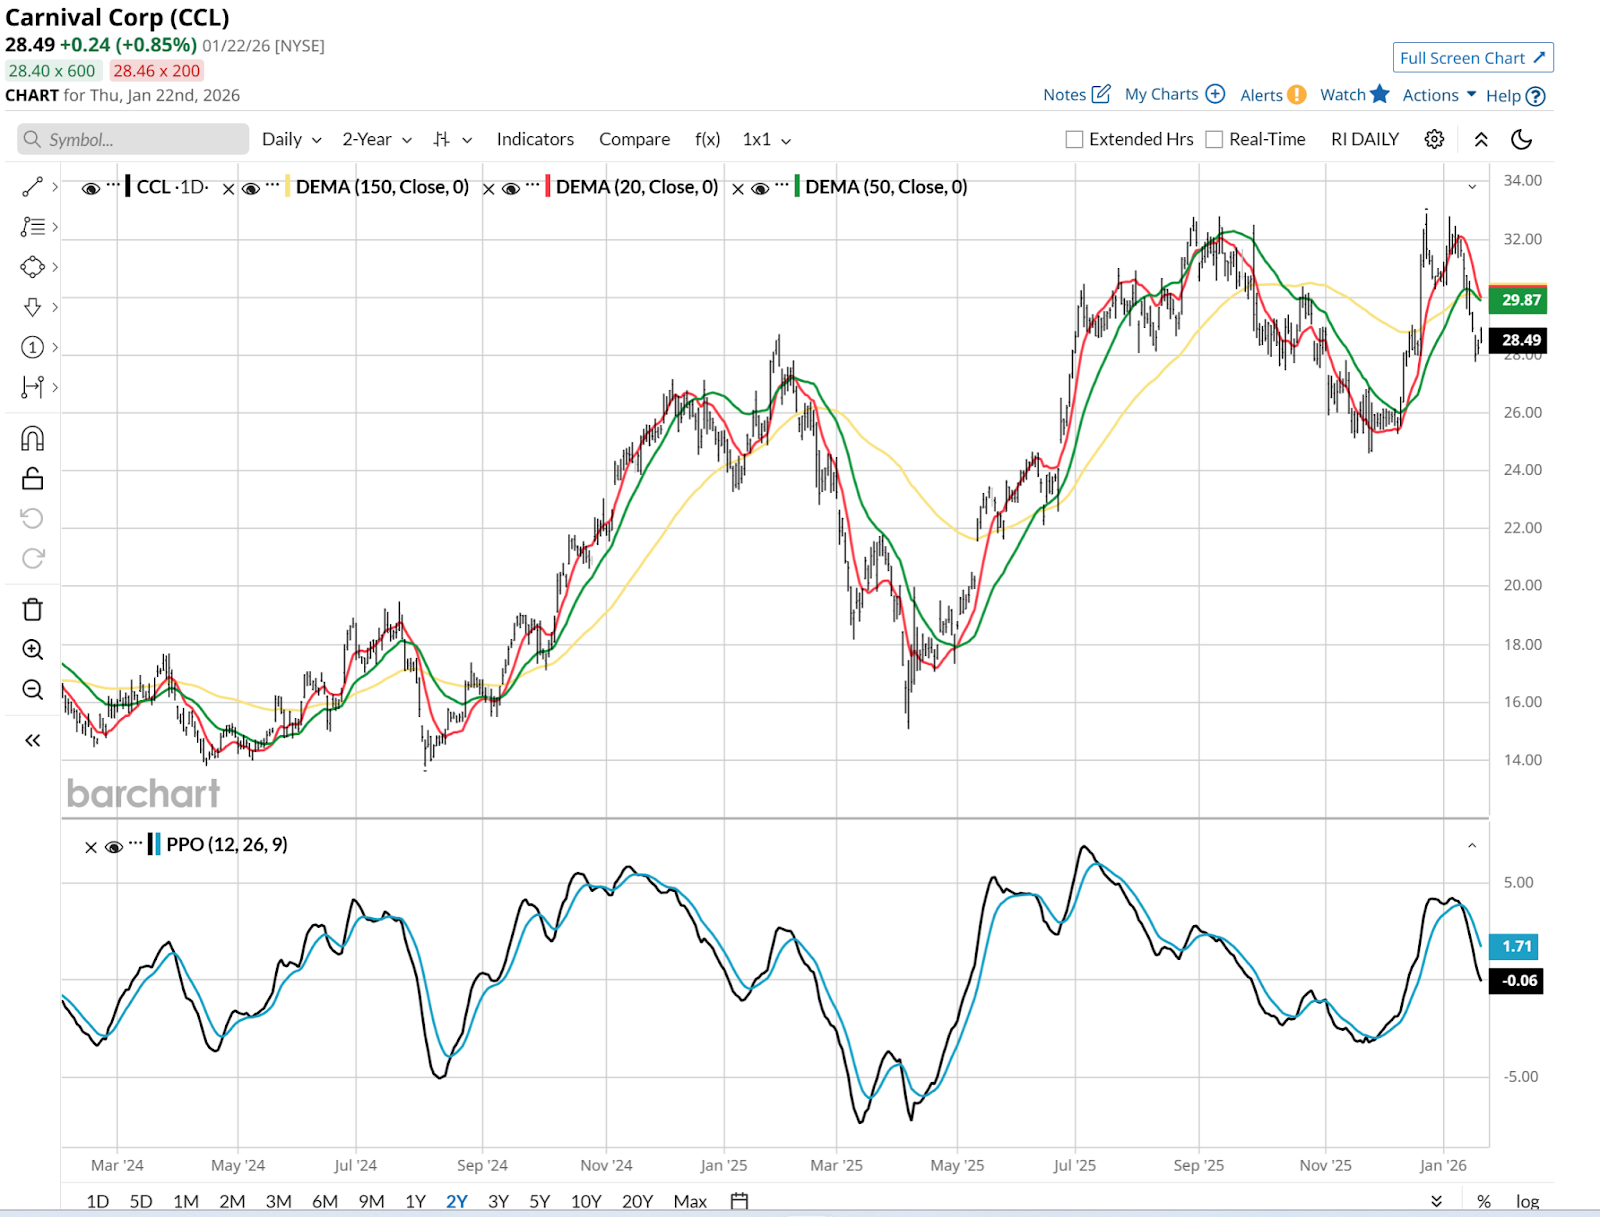
Next up, Carnival. The company delivered record revenue in 2025, but 2026 brings rising unit costs (up more than 3%) and global tax exposure. It trades at a discount to peers, but it’s been a "catch-a-falling-knife" trap for many lately.
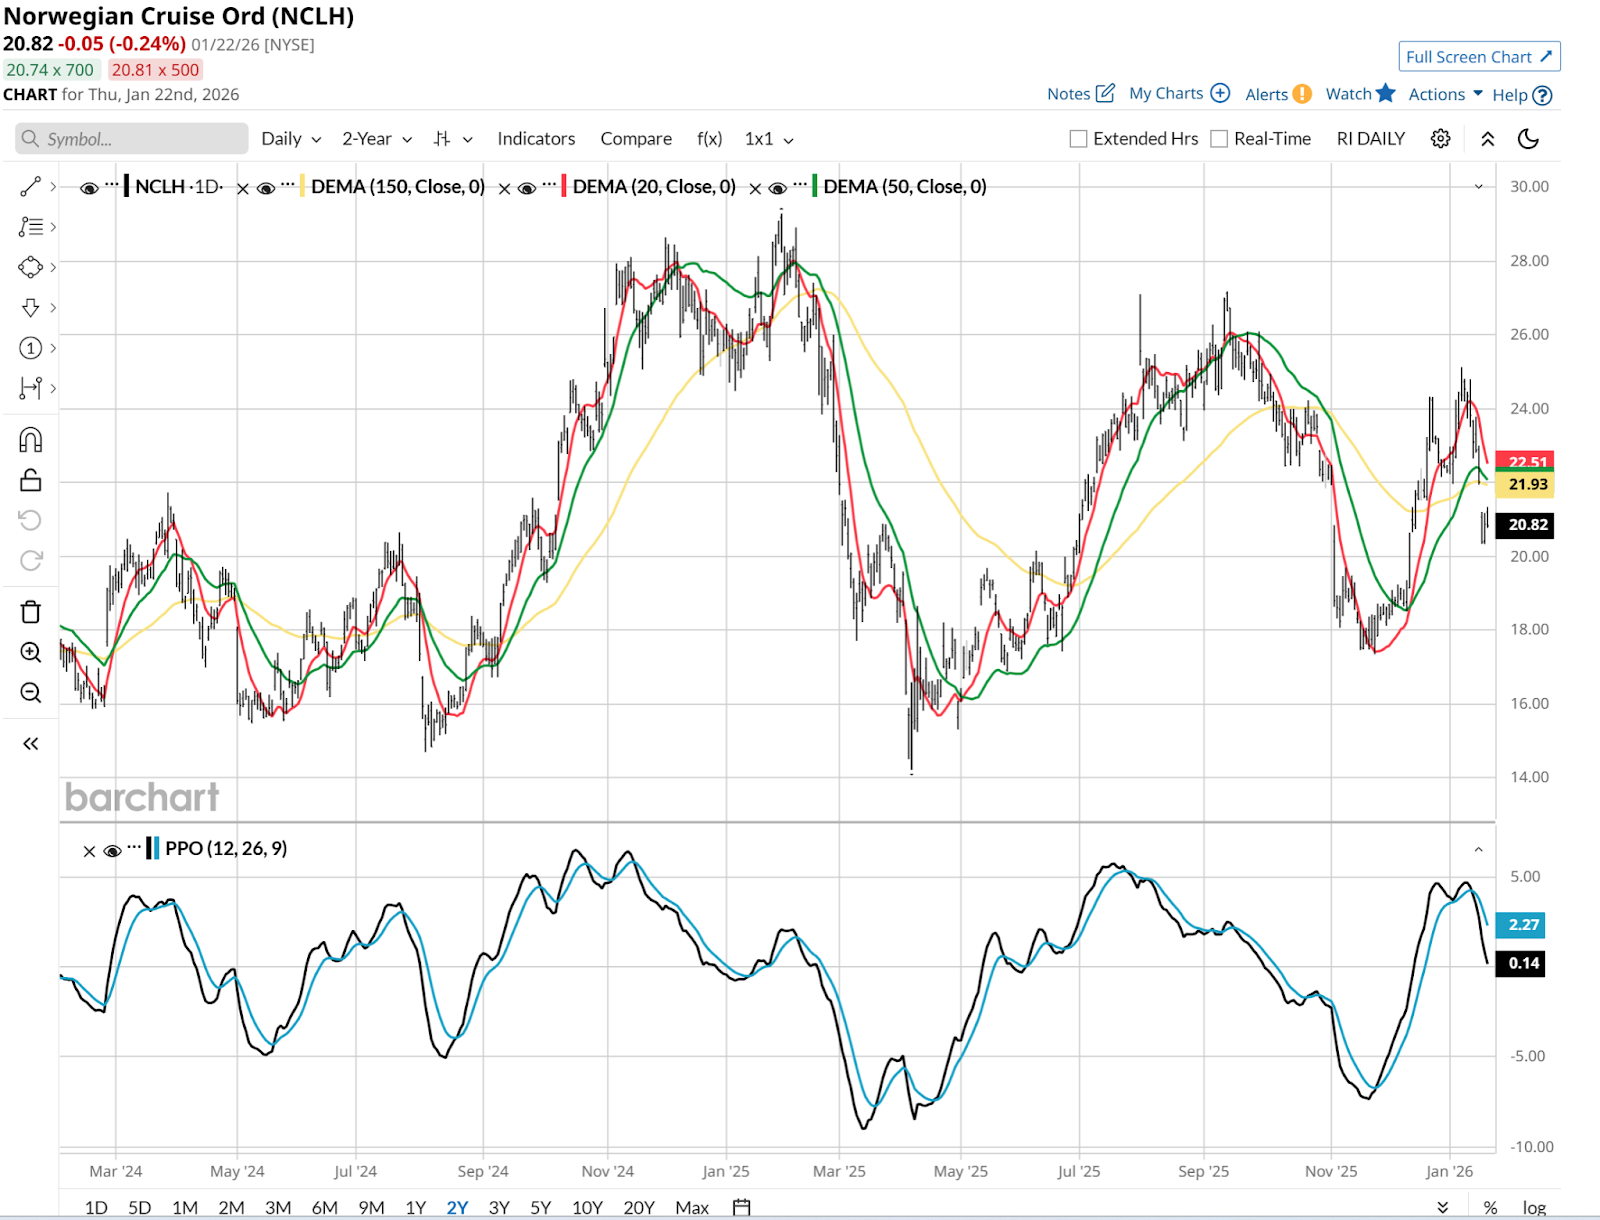
Lastly, Norwegian Cruise. NCLH has lagged, outperforming only a small portion of stocks in the S&P 500 Index ($SPX) over the past year.
When we put them side by side, we see that RCL is the biggest by a factor of more than double, in market capitalization terms. That’s despite CCL posting much higher annual sales. All three stocks are volatile, twice as rocky as the S&P 500, or more.
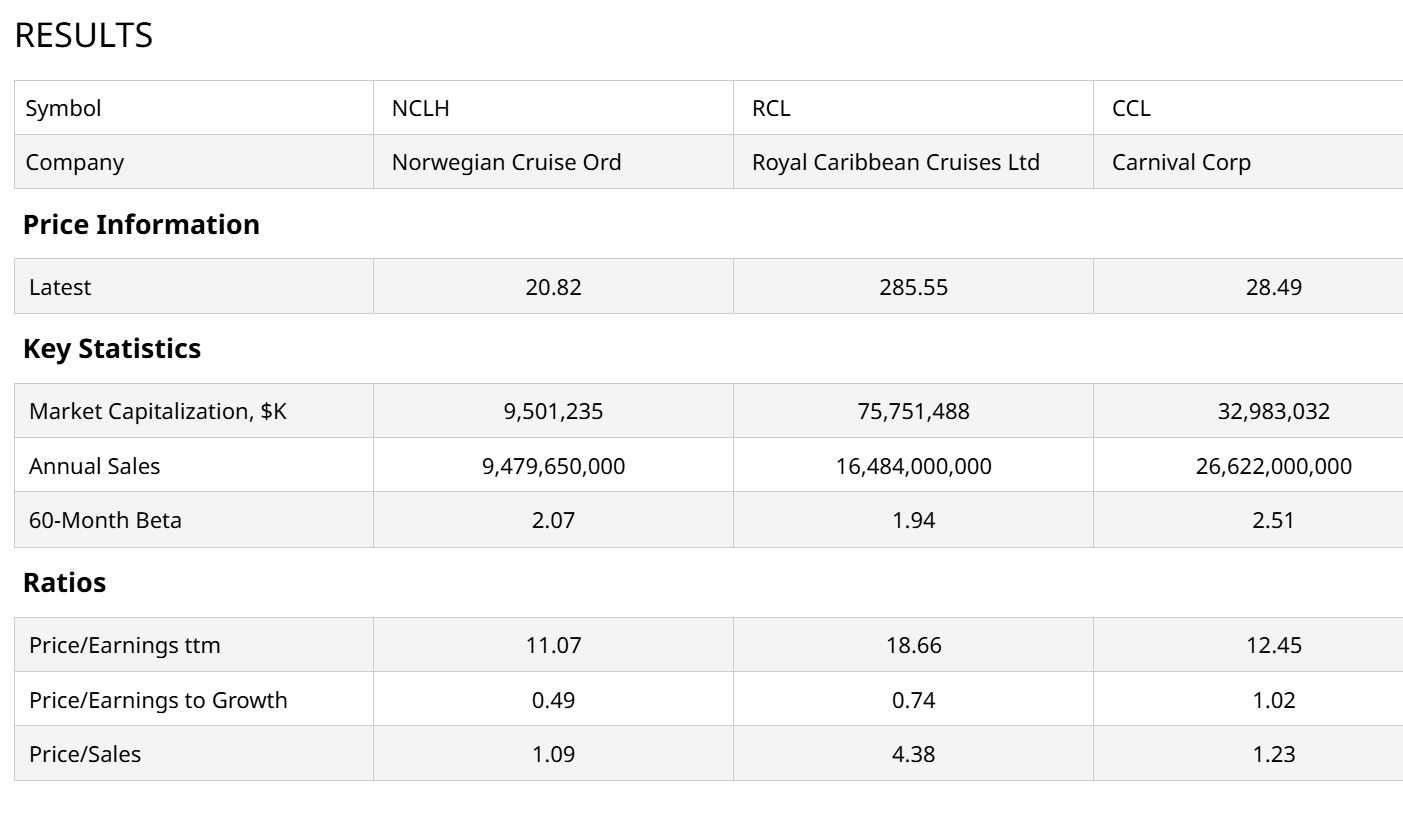
NCLH is the smallest by far, but also the cheapest. Its trailing price-to-earnings (P/E) of 11x is worth noting. Especially when it’s also selling at 1x sales and at half its growth.
Which Cruise Stock Is Best?
That’s like asking, “When you’re on that two-week cruise, do you prefer to get the flu, food poisoning, or be perpetually seasick?” None of these look good technically, and they often get treated similarly by Wall Street.
However, when I look beyond the near-term malaise, pressure building on the consumer, and the valuation differentials above, the long-term investor in me climbs aboard NCLH. I can’t help but see something in the charts that offers a clue as to why this could have long-term growth potential.
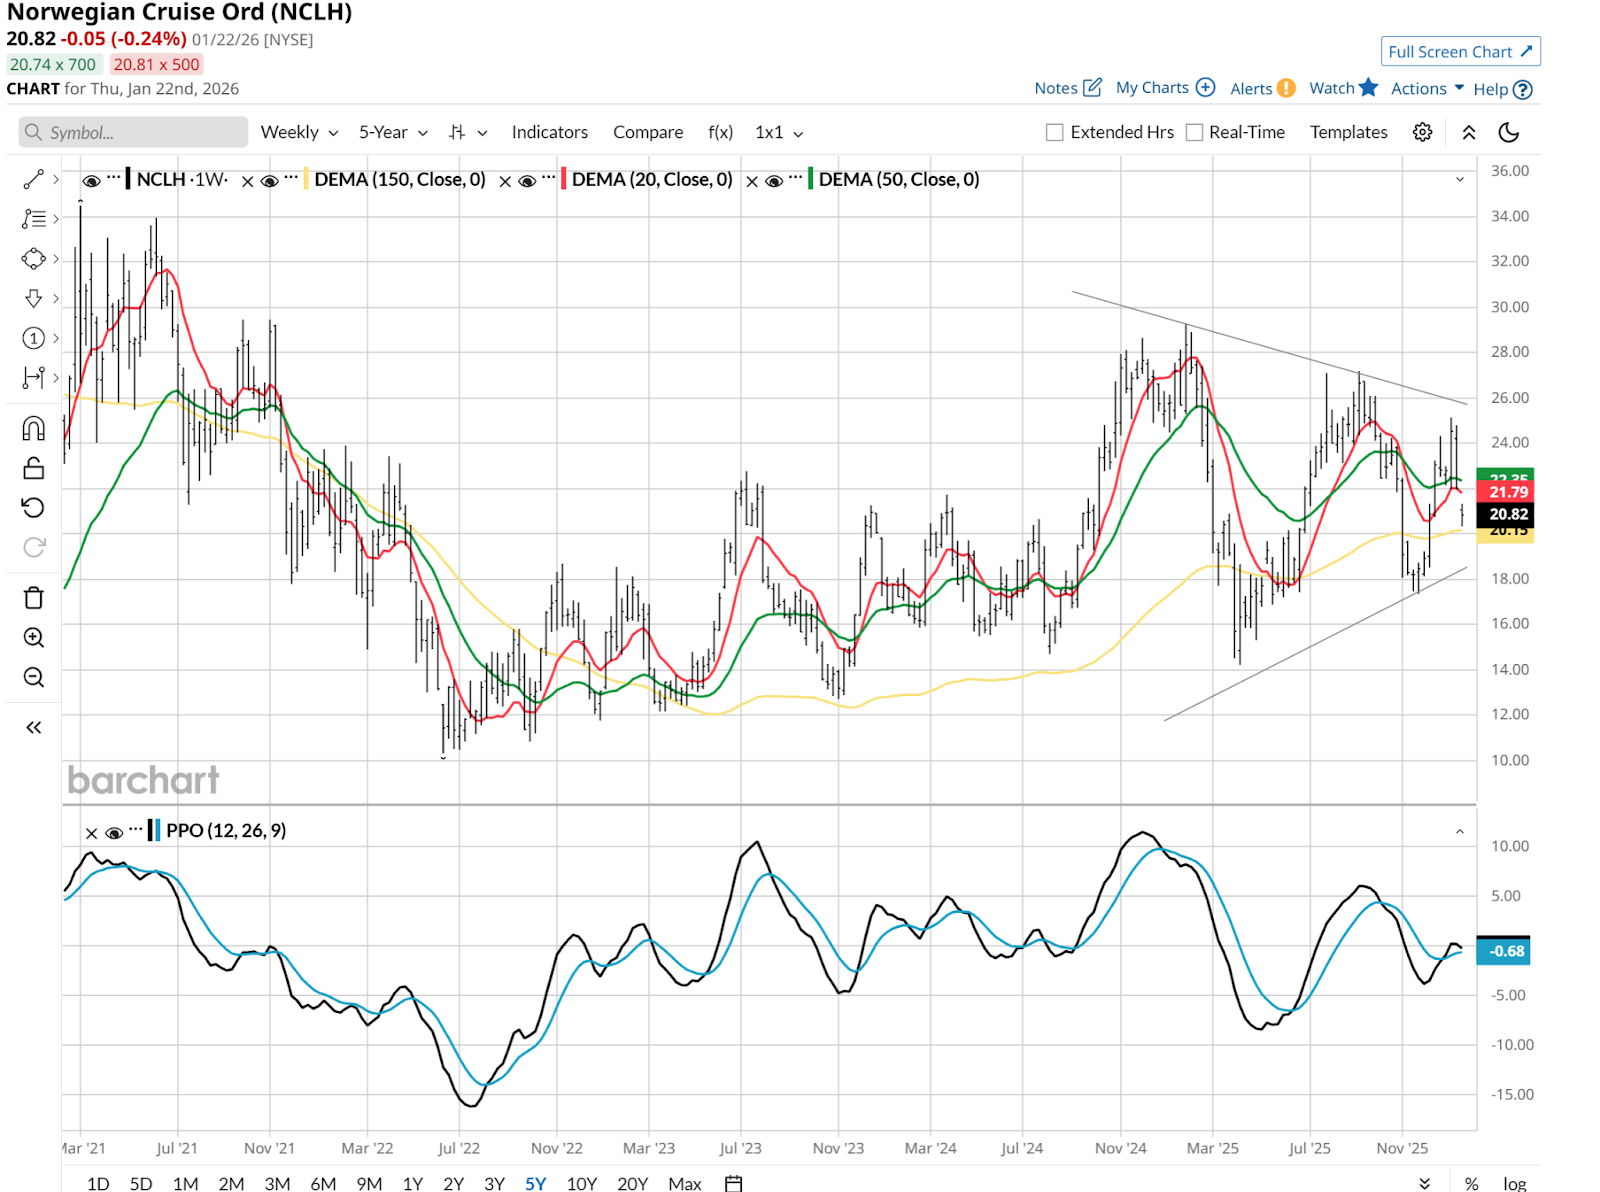
NCLH’s weekly chart is above, and it has a story to tell. See those trend lines I drew in thin black lines above and below recent activity? Remember, those price bars are weeks at a time, not days. And I see a narrowing effect.
Translation: While it's too soon to call this a great entry price, the stock is likely to give us a signal in the coming months. Specifically, if it breaks above the “triangle” pattern, say around the $25-$26 point, it could be a big mover. And if it fails below $18-19? How do I put it? That ship will have sailed.
Rob Isbitts is a semi-retired fiduciary investment advisor and fund manager. Find his investment research at ETFYourself.com. To copy-trade Rob’s portfolios, check out the new PiTrade app. His new blog on racehorse ownership as an alternative asset is at HorseClaiming.com.
On the date of publication, Rob Isbitts did not have (either directly or indirectly) positions in any of the securities mentioned in this article. All information and data in this article is solely for informational purposes. For more information please view the Barchart Disclosure Policy here.

/A%20Palantir%20office%20building%20in%20Tokyo_%20Image%20by%20Hiroshi-Mori-Stock%20via%20Shutterstock_.jpg)

/Corning%20Incorporated%20on%20screen%20in%20front%20of%20website%20By%20Timon.jpeg)
/A%20close-up%20of%20a%20SpaceX%20sign%20by%20Sundry%20Photography%20via%20Adobe%20Stock.jpeg)