Soybean Meal
The chart is key to this analysis.
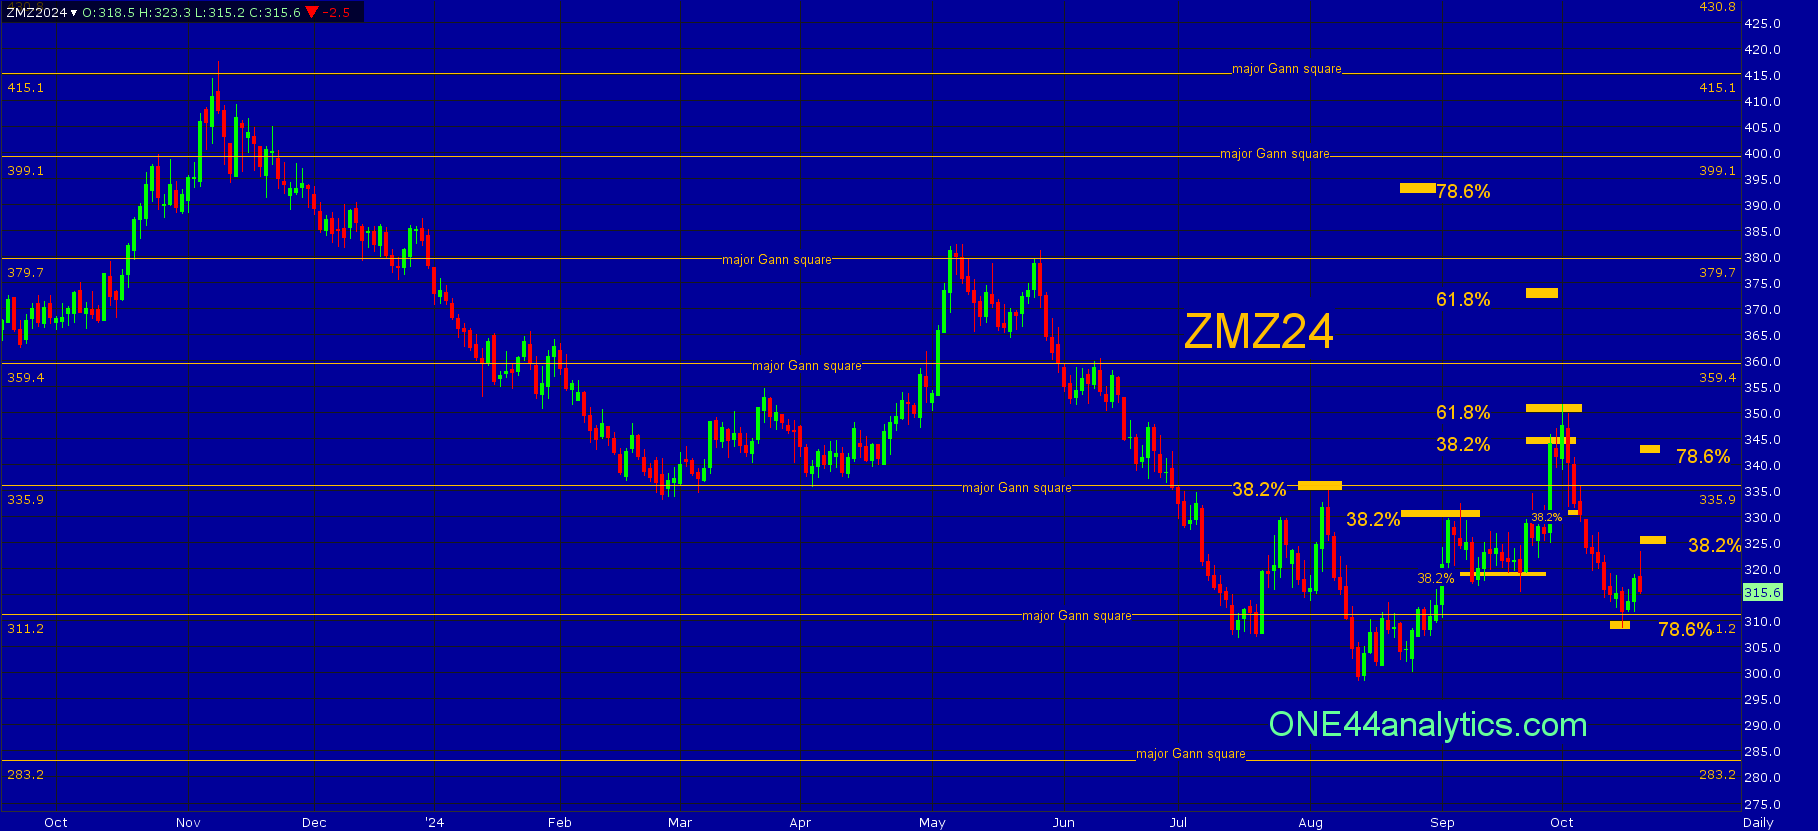
(ZMZ24)
December
From the 10/3/24 update
The rally since the last update hit the short term target of 38.2% at 344.00. It had one close above it and that high hit 61.8% at 350.00 and the next day closed back below 344.00, this is the long term swing point and a setback from it can send it a new low, or good test of it, so we will be watching the 78.6% level below. Holding 38.2% on any setback just as it did at 319.00 will keep the current trend positive.
From last week,
The break from 38.2% at 344.00 has now taken out 38.2% of the current rally and that turns the short term trend negative again. We are now looking for a good test of the low at 78.6% and a failure to turn up from there can send it to a new low. We will use 38.2% back to the 10/1/24 high as the swing point for the week,
Below it, look for the area of the 311.20 major Gann square and 78.6% back to the low at 310.00.....
This week's low took it right to the area of the 311.20 major Gann square and 78.65 at 310.00 (low was 308.80). This area will be key next week.
Use 310.00 as the swing point for the week.
Above it, the short term target is 78.6% the other way at 342.00 based on the ONE44 78.6% rule. Failing to make a new low after hitting 38.2% above at 344.00 will give us a long term target of 61.8% of the same move at 372.00. Any rally that can't get above 38.2% at 325.00 is a negative sign and new lows can quickly follow.
Below it, a failure to turn higher from 310.00 will give us only major Gann squares for support and then to use as the swing point when closed below, the next 2 are 283.20 and 255.60.
On the chart you can also see where the market found support and resistance at the major Gann squares (yellow horizontal lines).
Overview
From the 10/3/24 Update,
The current rallies are showing signs of life in Soybeans, Corn and Wheat, however they have all run into key retracements above. In Soybeans it is a 23.6% retracement, in Corn it is a combination of 23.6% and 38.2% and in Wheat it is 38.2%. We will be watching the 38.2% levels on any setback to see if the trends will continue.
Soybeans
It traded at 1055.00 all week. It was unable to get a couple solid closes above it and there was no follow through on the downside. A setback from 1055.00 can still send this market to a new low, or a good test of it, so we will be watching the 78.6% level as a target. The 38.2% level below will be key to the rally continuing, just as it was at 1002.00.
Corn
This week's rally took it to the short term target of 429.00 (23.6%/38.2%), it has one close above it and it needs another to turn the intermediate trend positive. A setback back from here can send it to a new low, or a good test of it. We will now watch 38.2% below to see if the short term trend can remain positive.
Wheat
This week's rally hit the short term target of 612.00 and it has one close above it, but today closed right back below it, this is the level that needs to come out to turn the Intermediate trend positive. We will be watching the 38.2% level on any setback to see if the short term uptrend can continue, just like it did at 566.75 on 9/19/24.
What we are seeing right now in the Grains illustrates the importance of understanding the Fibonacci retracements with the ONE44 rules and guidelines. By knowing the potential from a certain retracement it will give you guidance as to what is possible and what changes that. We have said before that a retracement from a bigger range ($1.00 to $2.00) should have precedence over a smaller range (30 to 50 cents), however this is also why we say, "we watch every retracement on all moves to see just how weak, or strong the market is regardless of the longer term target."
When the Grains ran into the longer term retracements above, Soybeans 23.6%, Corn 23.6%/38.2% and Wheat 38.2% we know that to keep that trend intact (down/negative) it should go make a new low, but we are watching the retracements on this setback. Soybeans are at 78.6% of the rally, Corn is just above 78.6% and Wheat is the one holding 38.2% for now. A couple things to keep in mind are, failing to make a new low after hitting a key retracement above that comes in the area of a 78.6% retracement can be the start of the next Bull move and holding 38.2% of a smaller move after hitting 38.2% of a much larger range above would be a strong sign for the market.
………………………
ONE44 Analytics where the analysis is concise and to the point
Our goal is to not only give you actionable information, but to help you understand why we think this is happening based on pure price analysis with Fibonacci retracements, that we believe are the underlying structure of all markets and Gann squares.
If you like this type of analysis and trade the Grain/Livestock futures you can become a Premium Member.
You can also follow us on YouTube for more examples of how to use the Fibonacci retracements with the ONE44 rules and guidelines.
We have done 43 videos on how to use the Fibonacci retracements with the ONE44 rules and guidelines. These Videos are worth watching even if it is not in the market you are trading, as the ONE44 rules and guidelines are the same for every market. You will also see why we believe the Fibonacci retracements are the underlying structure of ALL markets.
Sign up for our Free newsletter here.
FULL RISK DISCLOSURE: Futures trading contains substantial risk and is not for every investor. An investor could potentially lose all or more than the initial investment. Commission Rule 4.41(b)(1)(I) hypothetical or simulated performance results have certain inherent limitations. Unlike an actual performance record, simulated results do not represent actual trading. Also, since the trades have not actually been executed, the results may have under- or over-compensated for the impact, if any, of certain market factors, such as lack of liquidity. Simulated trading programs in general are also subject to the fact that they are designed with the benefit of hindsight. No representation is being made that any account will or is likely to achieve profits or losses similar to those shown. Past performance is not necessarily indicative of future results.
On the date of publication, Nick Ehrenberg did not have (either directly or indirectly) positions in any of the securities mentioned in this article. All information and data in this article is solely for informational purposes. For more information please view the Barchart Disclosure Policy here.
/The%20sign%20for%20Marvell%20Technology%20out%20front%20of%20a%20corporate%20office%20by%20Valeriya%20Zankovych%20via%20Shutterstock.jpg)
/Dell%20Technologies%20by%20Poetra_RH%20via%20Shutterstock.jpg)

/Intel%20Corp_%20badge%20holder-by%20hasrul_rais%20via%20Shutterstock.jpg)
