The US 30-year Treasury bond posted its fourth consecutive week of higher yields. After multiple economic reports this week reflecting a Goldilocks economy, which many market participants are looking for significant revisions to these reports, the yields are confirming that inflation is still too high and 2024 will see an excessive amount of Treasury debt issuance.
The FOMC will meet and announce its interest rate decision on January 31. Traders are implying a 97% chance rates will remain unchanged based on the CMEGroup Fed Watch tool. The press conference will be getting significant attention regarding how Powell will try to clarify what he told the markets at the December meeting.
CMEGroup Fed Watch tool

Source: CMEGroup Exchange
As of the January 26 close, market participants are factoring in a 46% chance of a rate cut at the March meeting. One month ago, after the Fed spiked the proverbial punch bowl at the holidays, there was a 70% chance of a rate cut. The equity markets are still drinking from the punch bowl and running off to all-time highs, mindlessly assuming these six rate cuts are coming in 2024. Interestingly, the Invesco S&P 500 equally weighted index fund (RSP) has not taken out last month's high or made a new all-time high, resulting in a select few markets moving to new highs.
Technical Picture

Source: Barchart.com
The continuous 30-year bond futures chart reveals the 118 handle as a significant pivot area from August 2023. The market peaked near 126 and is now making a lower high and low in a declining channel. Since August, the 118 level has been both support and resistance. The recent retest in early December may enhance the current downtrend if the price trades through it. At the end of 2023, the 30-year yield was 3.985%, and on January 26, it was trading at 4.378%. With the upcoming record Treasury debt issuance, inflation that is still higher than the Fed target, personal spending increasing by .7% in December following an upward revision in November, and the unknown long-term supply chain impact of the Red Sea issues, it seems more likely we continue seeing the long end of the yield curve continue to rise.
Traders in Financial Futures (TFF) report

Source: CMEGroup
The recent TFF report from the Commodity Futures Trading Commission (CFTC) offers an inside view of the leveraged funds short bias in the 30-year bond market. The price (yellow line) has steadily declined since 2021. During counter-trend moves, the leveraged traders would use this opportunity to dollar cost average short positions (orange vertical bars). The recent price rally was no exception, and they are near a three-year high in short positions again.
Seasonal Pattern

Source: Moore Research Center, Inc. (MRCI)
In a recent article, "US Dollar: Will the US Dollar Surprise to the Upside Soon?" I wrote, "An interesting seasonal correlation exists between the US dollar rally in February and the yield on the 10-year Treasury Note rally from February to the end of March. The US Government must issue more debt to raise cash for income tax refunds by the April 15 tax deadline. Higher yields - stronger dollar is a typical market correlation."
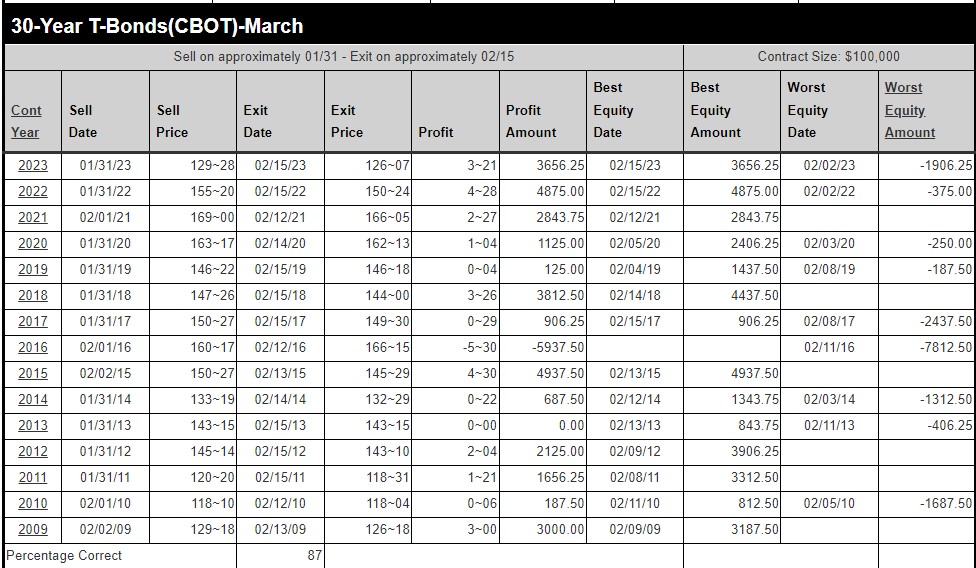
MRCI research refines this analysis to a more specific seasonal window for selling the 30-year bonds. Due to the close correlation between the 10-year note and the 30-year bond, a trader could use the 10-year note instead. Another trading opportunity could be using the 10Y micro-yield futures contract.
Historically, the bearish seasonal window has found that the 30-year bond closed lower on approximately February 15 than on about January 31, 87% of the time during the past 15 years. The table below illustrates that during the last 15 years, six did not have a daily closing drawdown.
It's important to note that while seasonal patterns can provide valuable insights, they should not be the sole basis for trading decisions. Traders must also consider other technical and fundamental indicators, risk management strategies, and market conditions to make well-informed and balanced trading choices.
Source: Research provided by MRCI
In closing
Long-term yields have risen since the first trading day of the New Year. Chairman Powell's press conference in December came when market liquidity was at its nadir. December traditionally sees more prominent traders closing positions and returning after the New Year. In another recent article, "Winter's Gift: A Bullish Seasonal Pattern Sets the Stage for Gold in Early 2024," I illustrated this fact with data from the CMEGroup exchange.
The FOMO traders listening to Powell's speech offered the professional traders a holiday gift by giving them a chance to sell at higher levels. Does this pattern look familiar in the current equity market conditions?
MRCI research reveals a 30-year bond-selling window, which has occurred for 87% of the past 15 years. The leveraged funds are near a three-year high in gross short positions before a seasonal window. Are their strategies keying off a similar seasonal pattern combined with the interest rate macro outlook and recent economic events?
More Stock Market News from Barchart
- Why Is Disney Stock So Low, While Netflix Stock Is Soaring?
- Stocks Finish Mixed as a Slump in Intel Weighs on the Overall Market
- SFIX vs. REAL: Which Small-Cap Stock Has More Upside Potential?
- Tesla Is Down, But FCF Is Still Strong and Put Premiums Are High and Are Worth Shorting
On the date of publication, Don Dawson did not have (either directly or indirectly) positions in any of the securities mentioned in this article. All information and data in this article is solely for informational purposes. For more information please view the Barchart Disclosure Policy here.
/A%20close-up%20of%20a%20SpaceX%20sign%20by%20Sundry%20Photography%20via%20Adobe%20Stock.jpeg)


