
The economic Law of Supply and Demand is about as simple as any law can be, and useful when it comes to understanding REAL fundamentals in the Grains sector.
To understand the supply and demand situation, I use National Cash Indexes (national average prices) for the five major grain markets.
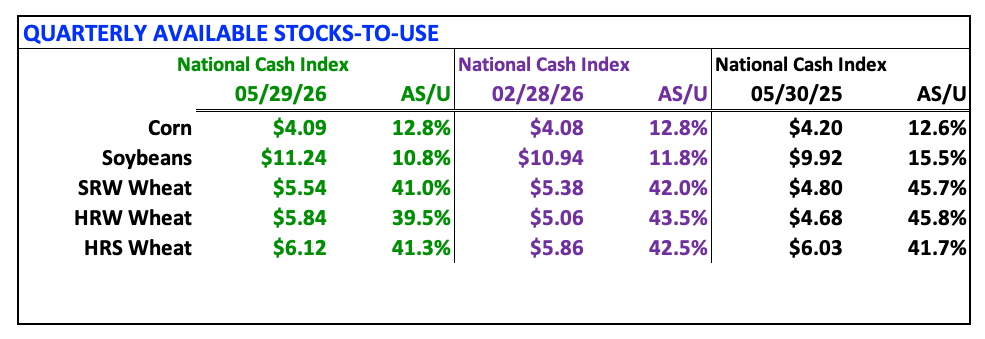
It's interesting to note the big mover this past quarter and year was soybeans despite mixed year-to-year demand changes of more crush and less exports.
The Law of Supply and Demand: Market Price is the point where the quantity demanded equals quantities available creating a market equilibrium. If we consider the three variables in the equation (Market Price = Supply, Demand) the only one known is Market Price. Therefore, a study of Market Price is all that is needed to understand the relationship between the unknown variables of Supply and Demand. For Market Price I’m using National Cash Indexes for the 5 major grain markets.
CORN: The National Corn Index ($CNCI) was priced at $4.09 at the end of May, the end of the 2025-2026 Q3, putting the available stocks-to-use (as/u) figure at 12.8%. The end of February (Q2) saw the Index priced at $4.08 with as/u also at 12.8%. At the end of May 2025 the numbers were $4.20 and 12.6%. The bottom line is US corn supply and demand has not changed much over the past year as the summer season (Q4) begins. Some other numbers of interest: The May Index price was below the previous 5-year low end of May figure of $4.20 (2025) and near the previous 10-year average price of $4.1o. In other words, there is nothing extraordinary about US corn fundamentals to keep long-term investors interested in the market.
SOYBEANS: The National Soybean Index ($CNSI) was priced at $11.24 at the end of May, the end of the 2025-2026 Q3, putting the available stocks-to-use (as/u) figure at 10.8%. The end of February (Q2) saw the Index priced at $10.94 with as/u at 11.8%. At the end of May 2025 the numbers were $9.92 and 15.5%. We can see the effects of the smaller 2025 crop while domestic crush demand runs 8% ahead of the previous marketing year and export demand is down about 20% year-to-year. The US supply and demand situation tightened over the past quarter. Historically, the May 2026 Index price was below the previous 5-year average of $12.75 but above the previous 10-year average of $10.05. The bottom line is the US will not run out of soybeans during Q4. Probably. But the situation is such that is should continue to support the long-term investment position in the market (see Monthly Analysis).
SRW WHEAT: The National SRW Wheat Index ($CSWI) was priced at $5.54 at the end of May, the end of the 2025-2026 marketing year, putting the available stocks-to-use (as/u) figure at 41.0%. The end of February (Q3) saw the Index priced at $5.38 with as/u at 42.0%. At the end of May 2025 the numbers were $4.80 and 45.7%. The May 2026 Index price was below the previous 5-year average end of the marketing year figure of $6.22 but above the 10-year average price of $4.99. The bottom line is while US supply and demand tightened during Q4, it is far from tight, as the 41% as/u would suggest.
HRW WHEAT: The National HRW Wheat Index ($CRWI) was priced at $5.84 at the end of May, the end of the 2025-2026 marketing year, putting the available stocks-to-use (as/u) figure at 39.5%. The end of February (Q3) saw the Index priced at $5.06 with as/u at 43.5%. At the end of May 2025 the numbers were $4.68 and 45.8%. The May 2026 Index price was below the previous 5-year average end of the marketing year figure of $6.82 but above the 10-year average price of $4.89. The bottom line is while US supply and demand tightened during Q4, it is far from tight, still running near 40% heading into the 2026 harvest.
HRS WHEAT: The National HRS Wheat Index ($CRSI) was priced at $6.12 at the end of May, the end of the 2025-2026 marketing year, putting the available stocks-to-use (as/u) figure at 41.3%. The end of February (Q3) saw the Index priced at $5.86 with as/u at 42.5%. At the end of May 2025 the numbers were $6.03 and 41.7%. The May 2026 Index price was below the previous 5-year average end of the marketing year figure of $7.00 but above the 10-year average price of $6.02. The bottom line is while US supply and demand tightened during Q4, it is far from tight, still running near 41% heading into summer quarter (Q1).
On the date of publication, Darin Newsom did not have (either directly or indirectly) positions in any of the securities mentioned in this article. All information and data in this article is solely for informational purposes. For more information please view the Barchart Disclosure Policy here.
/A%20Palantir%20office%20building%20in%20Tokyo_%20Image%20by%20Hiroshi-Mori-Stock%20via%20Shutterstock_.jpg)
/A%20hand%20holding%20a%20phone%20with%20the%20Reddit%20logo_%20Mamun_Sheikh%20via%20Shutterstock_.jpg)
/BlackRock's%20global%20headquarters%20By%20Tada%20Images.jpeg)
/The%20CoreWeave%20logo%20displayed%20on%20a%20smartphone%20screen_%20Image%20by%20Robert%20Way%20via%20Shutterstock_.jpg)
/Apple%20logo%20on%20store%20front%20by%20frantic00%20via%20iStock.jpg)