

Specifications and statistics
Wheat futures began trading in 1877. Similar to how the markets trade today, where a producer of wheat (seller) would make a contract with a consumer of wheat (buyer), the exchange would act as an intermediary guaranteeing the contract for both parties.
Initially, there were three US futures exchanges trading wheat, the Chicago Board of Trade (CBOT), the Kansas City Board of Trade (KCBT), and the Minneapolis Grain Exchange (MGEX). Over time, the KCBT, the CBOT, and the MGEX were acquired by the Chicago Mercantile Group (CMEGroup). For this article, we will refer to the CBOT wheat futures contract.
Wheat is grown in more locations worldwide than any other form of commercially grown food. The US is the world leader in corn, but wheat is traded more than any other crops combined worldwide. The CBOT wheat contract is referred to as the soft red winter (SRW) wheat. Once refined, the wheat is processed and refined into flour and used for baking cakes, cookies, crackers, and many other confectionery products.
China, India, and Russia are the world's most significant individual wheat producers making up approximately 41% of the world's total production. At the same time, the US comes in as the fourth largest producer of wheat.
Wheat futures are very liquid, with an average volume exceeding 150K contracts daily.
Cumulative open interest in the wheat market is around 300k contracts. Corn and soybeans trade more volume and open interest than wheat.
Currently, the front-month contract is December and is trading at 900'0 cents per bushel. The notional value of the contract traded is $45,000. To trade wheat overnight, the required margin per contract is $3,300. A trader will have 14:1 leverage trading wheat.
Recent Performance
Wheat has a solid return of 17% year-to-date. For the third quarter, wheat was positive but lagging behind the year-to-date performance with a 3% return. The average daily range is 40 cents, with an average dollar range of $2,000.
Fundamentals of Wheat
The United States Department of Agriculture (USDA) will release its monthly report on October 12, 2022. Estimates for US wheat carryout is .554 million tons, down from last month's report of .610 million tons. Estimates for World wheat carryout are 267.49 million tons compared to the previous month's report of 268.57 million tons. These estimates are bullish for the price of wheat. The question becomes, does the actual report match the estimates?
The war is an ongoing geopolitical event with no clear end in sight. There were reports that Russia and Ukraine might be open to diplomacy to slow or end the current war. When the news was released, wheat prices dropped. Expect this volatility to continue in the grain markets.
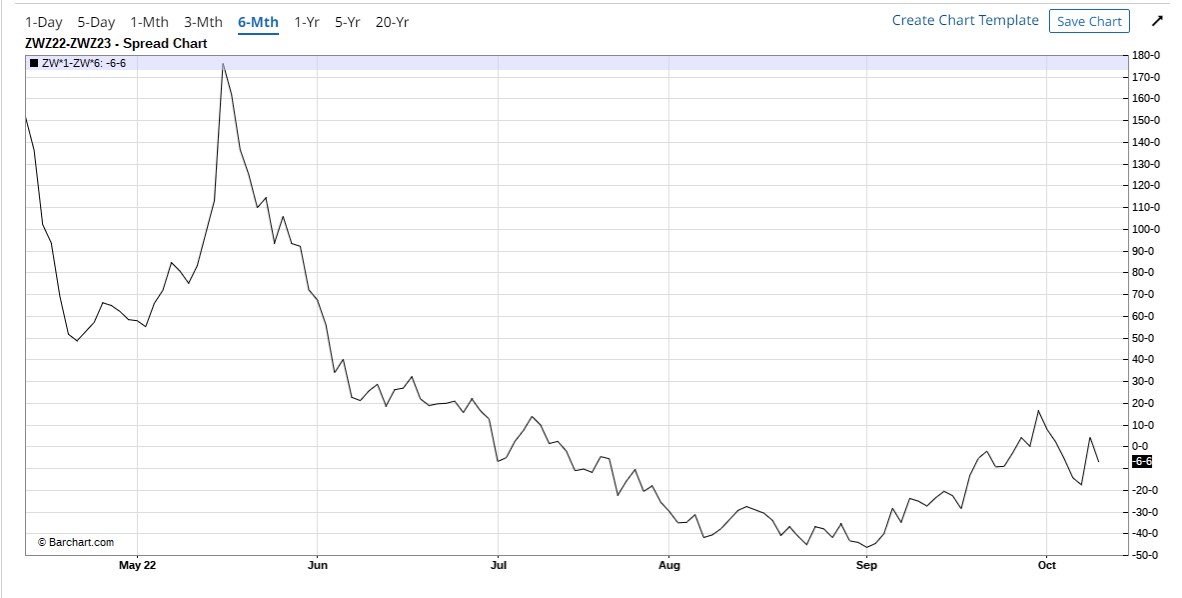
Spreads
Looking at the year-over-year December spread of wheat, we can see the large swings this spread has made during the previous six months. Until July, the spread was in backwardation (front-month contract price higher than a back-month contract). From July to October, the market stayed in contango (near-month priced lower than a back-month). Now the spread is trying to close above the zero line and go into backwardation again. If this happens, wheat could make another bullish move.
Technicals
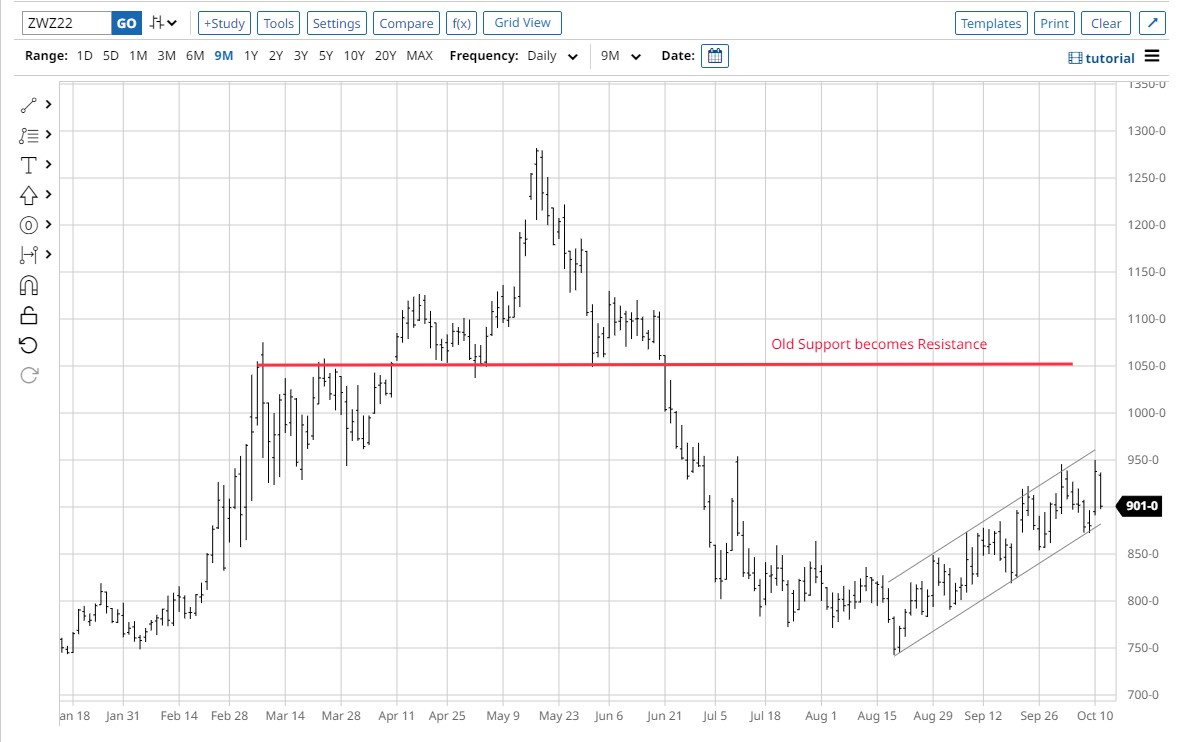
The daily chart shows us a well-defined uptrend respecting both sides of the channel. Currently, the market is near some prior resistance from March and July. If the price can trade through this resistance, the next area of resistance will be in the 1050'0 area.
Seasonality
Source: Moore Research Center, Inc. (MRCI)
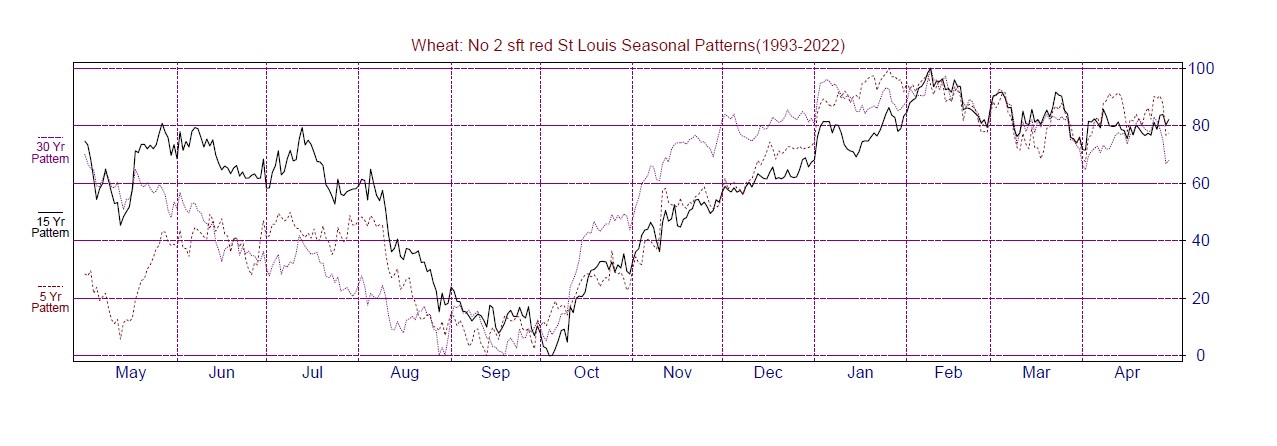
I find using seasonal patterns properly requires additional technical or fundamental analysis. MRCI's seasonal pattern of the cash wheat market reveals not only the 15-year average but the 5 and 30-year average, making a solid seasonal low in early October. The wheat market already has a daily uptrend supporting this seasonal pattern. What else could help support MRCI's seasonal research?
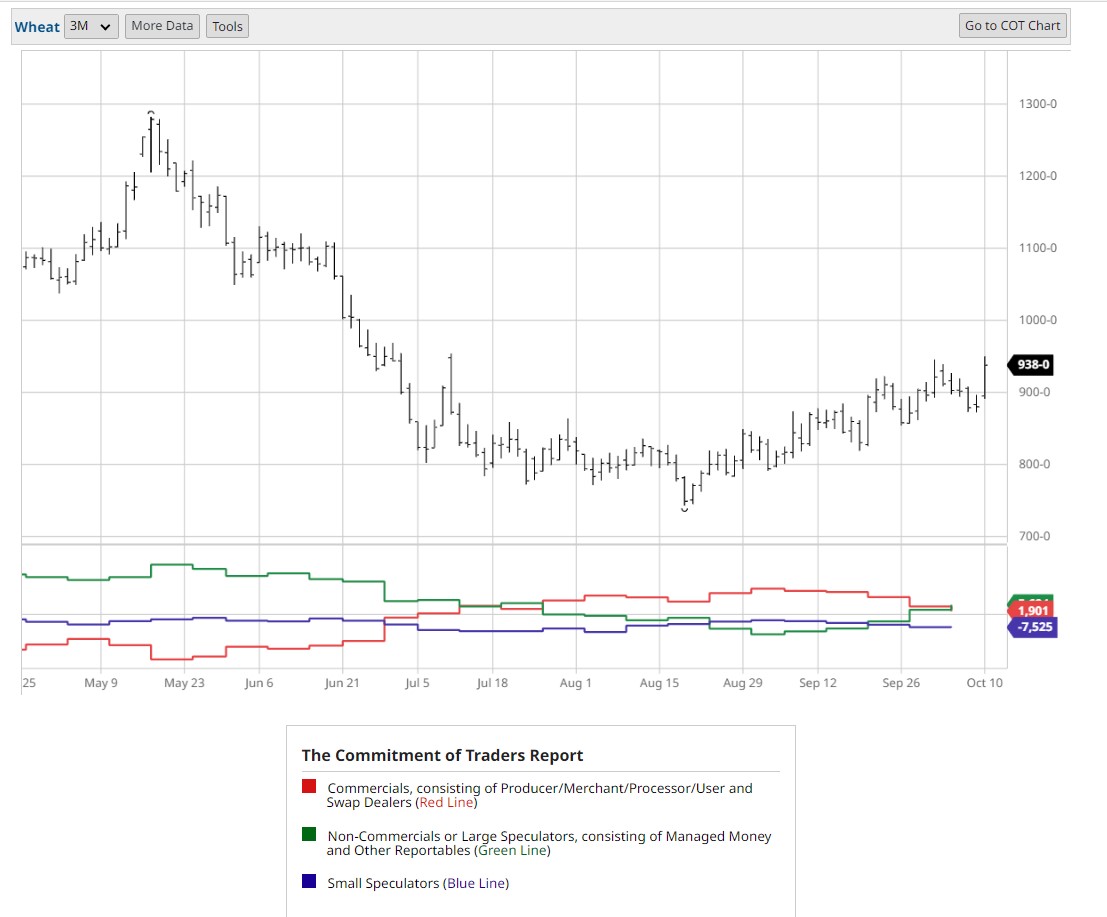
The Commitment of Traders (COT Report)
You guessed it, the COT report!
Notice how when the price bottomed in August, the commercial traders aggressively added to their long positions (upsloping red line). At the same time, the large speculators (green line) were selling their positions. Once the commercial traders turned the price up, the large speculators (trend followers) started adding to their long positions. Each week since, the large speculators have continued to buy.
Related ETFs and Mini Contracts to Participate in Wheat
The ETF to trade is (WEAT). The standard-size wheat contract (ZW) is the preferred choice, but if you need a smaller, less expensive contract, there is a mini-wheat contract (XW). Be aware that the ETF can sometimes become illiquid, causing possible slippage on your fill prices.
Summary
Crop reports can move quickly and sometimes go the day's lock limit. With the monthly USDA report due out on October 12, 2022, we could see some volatility if the carryout numbers are not in line with the estimates. If you wish to trade wheat, I would wait until after the report is released and then consider placing your orders.
In the longer term, this trade has a solid seasonal pattern. With the large speculators still buying at these levels, it could be good news for the uptrend. Keep an eye out as the market approaches the overhead resistance. Always have a plan and risk management skills.
On the date of publication, Don Dawson did not have (either directly or indirectly) positions in any of the securities mentioned in this article. All information and data in this article is solely for informational purposes.


/Visa%20Inc%20gold%20card-by%20hatchpong%20via%20iStock.jpg)
