
A bull call spread is an options strategy that a trader uses when they believe the price of an underlying stock will move higher in the short term.
To execute the strategy, a trader would buy a call option and sell a further out-of-the-money call option with the following conditions:
- Both call options must use the same underlying stock
- Both call options must have the same expiration
- Both call options must have the same number of options
Since the strike price of the sold call is higher than the strike price of the bought call, the initial position will be a net debit.
The bull call spread profits as the price of the underlying stock increases, similar to a regular long call.
The difference between a bull call spread and a regular long call is that the upside potential is capped by the short call.
The purpose of the short call is to mitigate some of the overall costs of the strategy at the expense of putting a ceiling on the profits.
Losses are also capped, in this case by the debit taken when you execute the trade.
Let’s take a look at Barchart’s Bull Call Spread Screener for September 6th:
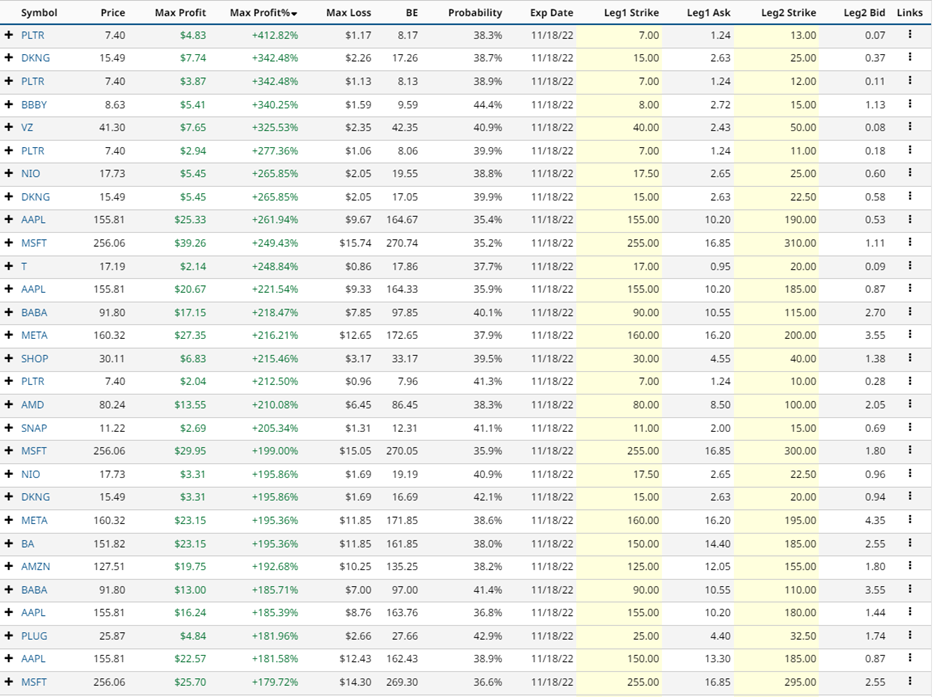
As you can see, the scanner shows some interesting Iron Condor trades on stocks such as PLTR, DKNG, BBBY, VZ, NIO, AAPL, MSFT, T and BABA.
Let’s adjust the scanner to make sure we are only looking for bull call spreads on stock with a Buy rating and Mark Cap above 40 billion.
This scan gives us the following results:

ADP Bull Call Spread Example
Let’s take a look at the first line item – a bull call spread on ADP.
This bull call spread trade involves buying the November expiry 230 strike call and selling the 240 strike call.
Buying this spread costs around $6.50 or $650 per contract. That is also the maximum possible loss on the trade. The maximum potential gain can be calculated by taking the spread width, less the premium paid and multiplying by 100. That give us:
10 – 6.50 x 100 = $350.
If we take the maximum gain divided by the maximum loss, we see the trade has a return potential of 53.85%.
The probability of the trade being successful is 52.60%, although this is just an estimate and does not indicate the probability of achieving the maximum profit.
The spread will achieve the maximum profit if ADP closes above 240 on November 18. The maximum loss will occur if ADP closes below 230 on November 18, which would see the trader lose the $650 premium on the trade.
The breakeven point for the Bull Call Spread is 236.50 which is calculated as 230 plus the $6.50 option premium per contract.
The Barchart Technical Opinion rating is an 80% Buy with an average short term outlook on maintaining the current direction.
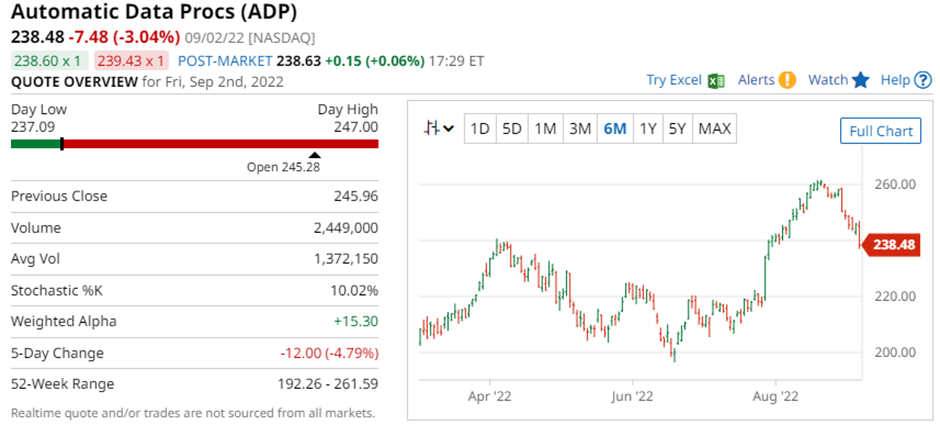
ADP is showing an IV Percentile of 51% and an IV Rank of 45.22%. The current level of implied volatility is 24.76% compared to a 52-week high of 35.46% and a low of 15.92%.
OXY Bull Call Spread Example
Let’s look at another example, this time using Occidental Petroleum (OXY)
This bull call spread also uses the November expiry and involves buying the 67.50 strike call and selling the 70 strike call.
This trade would cost $140 and have a maximum potential profit of $110.
The Barchart Technical Opinion rating is a 100% Buy with a strengthening short term outlook on maintaining the current direction.
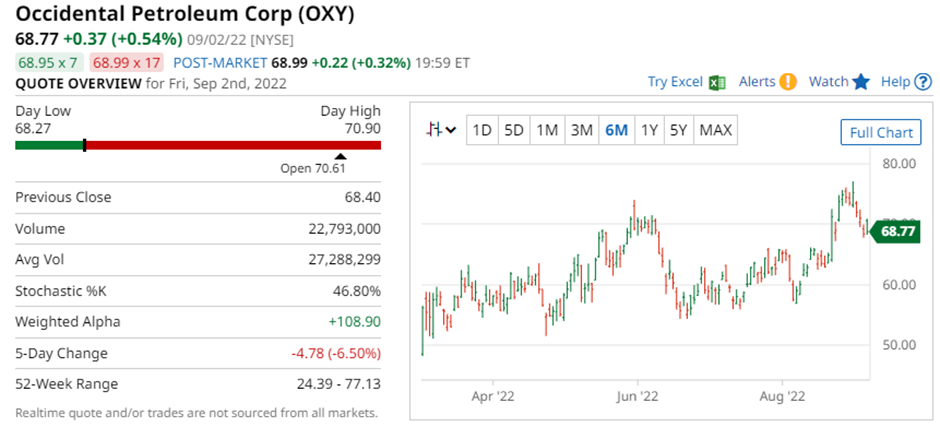
OXY is showing an IV Percentile of 52% and an IV Rank of 25.12%. The current level of implied volatility is 55.98% compared to a 52-week high of 89.88% and a low of 44.61%.
Mitigating Risk
Thankfully, bull call spreads are risk defined trades, so they have some build in risk management. The most the ADP example can lose is $650 while the OXY call spread has risk of $140.
For each trade consider setting a stop loss of 25-30% of the max loss.
Also keep an eye on key support levels and moving averages.
Please remember that options are risky, and investors can lose 100% of their investment. This article is for education purposes only and not a trade recommendation. Remember to always do your own due diligence and consult your financial advisor before making any investment decisions.
*Disclaimer: On the date of publication, Gavin McMaster did not have (either directly or indirectly) positions in any of the securities mentioned in this article. All information and data in this article is solely for informational purposes. Data as of after-hours, September 5, 2022.
More Stock Market News from Barchart

/AI%20(artificial%20intelligence)/Data%20Center%20by%20Caureem%20via%20Shutterstock%20(2).jpg)

/AI%20(artificial%20intelligence)/Ai%20chip%20by%20Quality%20Stock%20Arts%20via%20Shutterstock.jpg)
/A%20corporate%20sign%20for%20SK%20Hynix%20by%20Tada%20Images%20via%20Adobe%20Stock.jpeg)