
Lean Hogs May '25 (HEK25)
[[ item.lastPrice ]] [[ item.priceChange ]] ([[ item.percentChange ]]) [[ item.tradeTime ]] [CME]
[[ item.bidPrice ]] x [[ item.bidSize ]] [[ item.askPrice ]] x [[ item.askSize ]]
for [[ item.sessionDateDisplayLong ]]
Find the latest Lean Hogs prices and Lean Hogs futures quotes for all active contracts below.
[[ timeframe ]] futures price quotes as of Sun, Jun 7th, 2026.
Latest price quotes as of [[ snapshotDate ]].
[[ timeframe ]] futures price quotes, based on [[ timeframe ]] data.
Looking for expired contracts? Check out our Lean Hogs Historical Prices page.
Soybean Analysis & Targets
Educational and Actionable information using Fibonacci and W.D. Gann analysis.
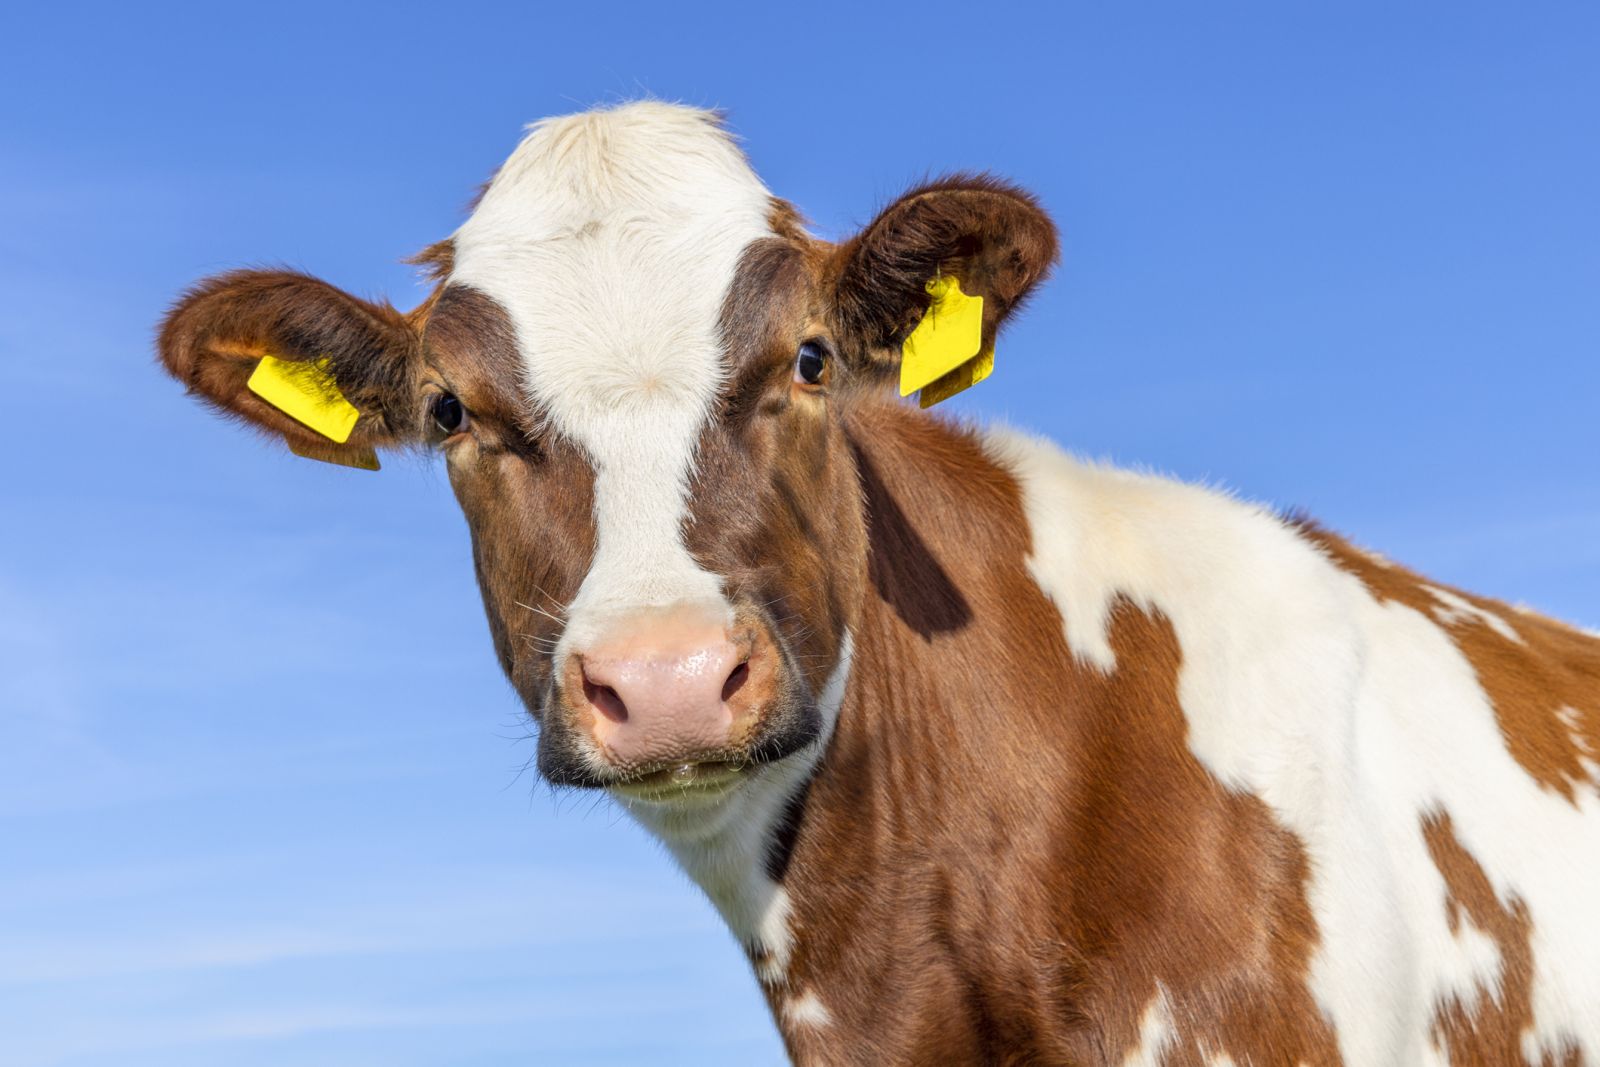
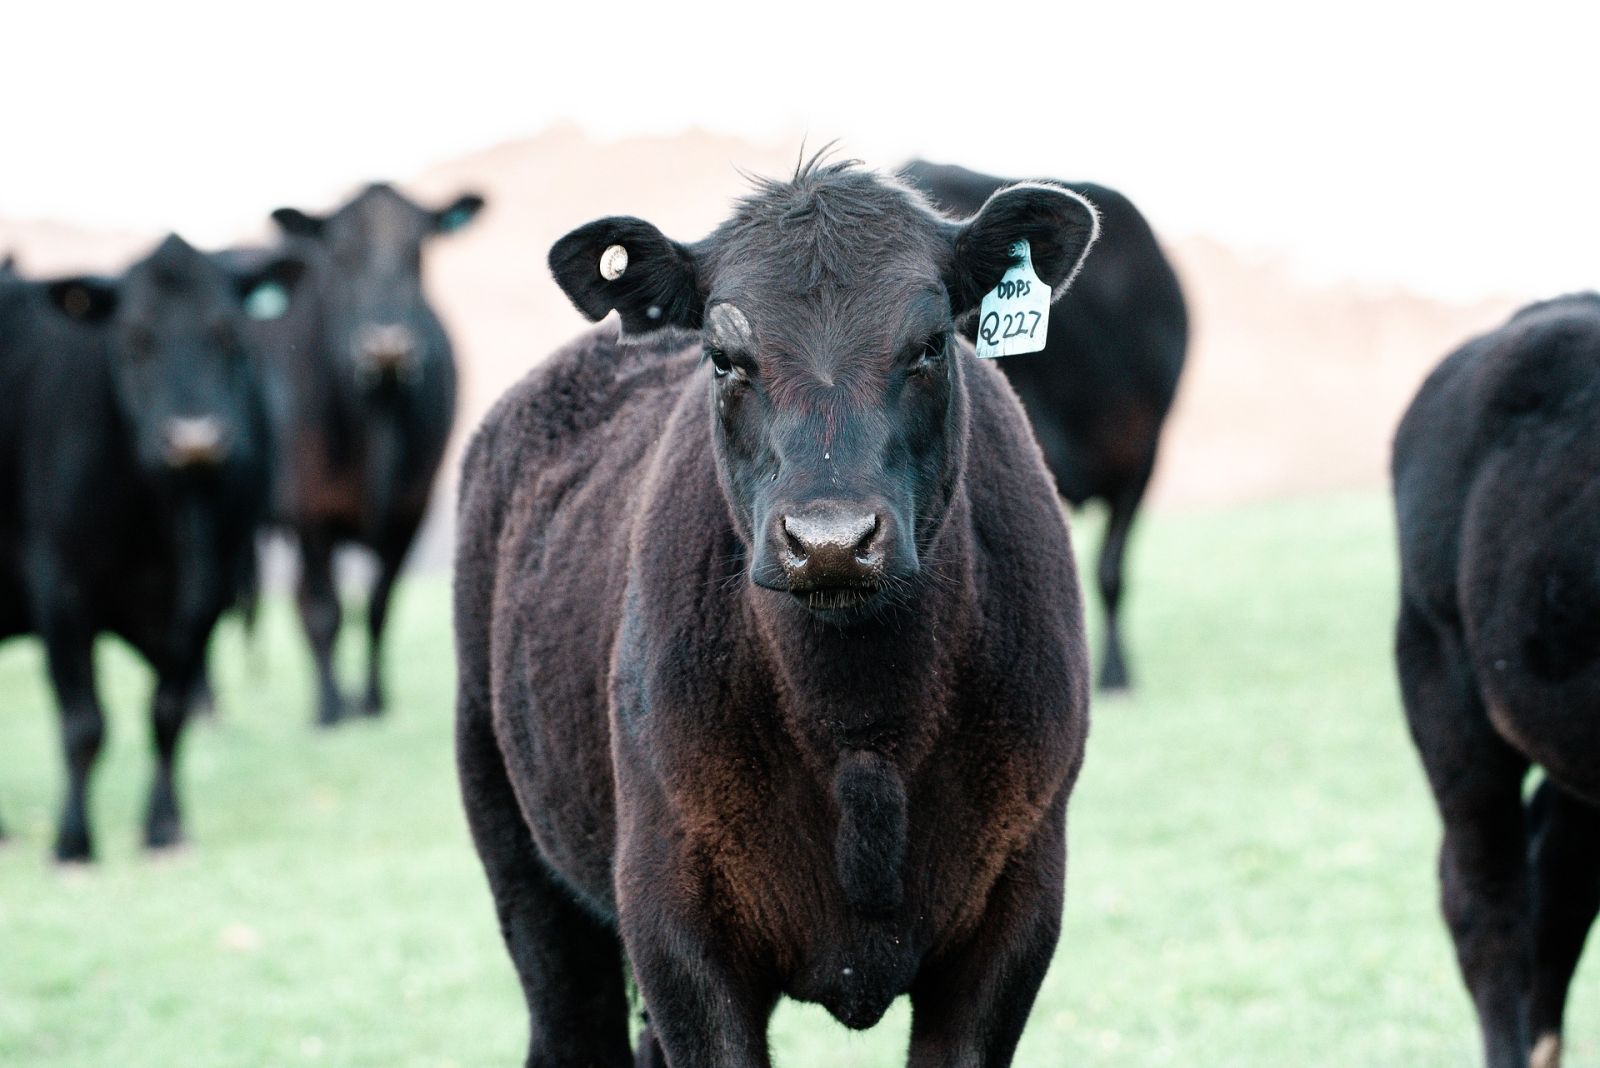
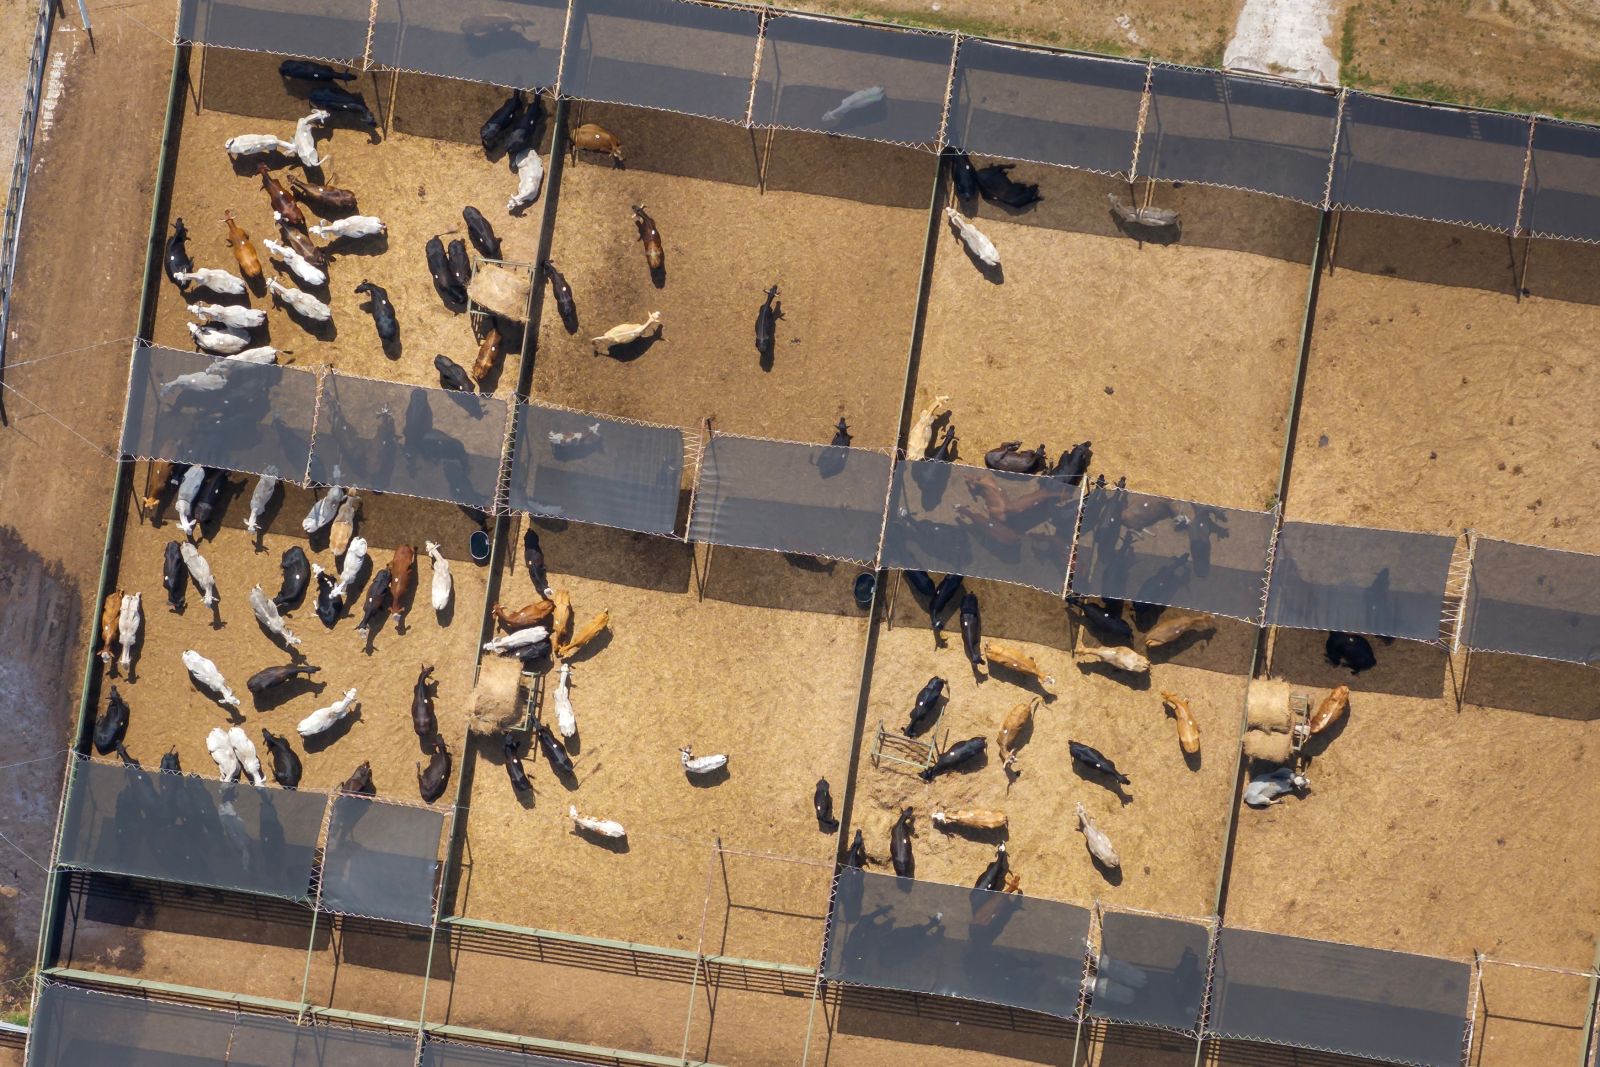
Are US Cattle Screwed - Again?
As spring turns to summer, US beef headlines have announced the return of the New World Screwworm.
Cattle Markets Surge and Then Crash
Screwworm fears topple rally
Cattle Come Back to Close Higher on Friday
Live cattle futures saw weaker midday action though futures pulled off the lows to close up 12 cents to $1.12, as June was up $1.82 this week. Cash trade...
Hogs Fall Lower into the Weekend
Lean hog futures posted Friday losses of 30 cents to $2.80, led by July, as June was down $1.55 this week. USDA’s national base hog price was reported...
Shootin' the Bull about an easy comment
I have no idea what the next most probable move will be in price for fats or feeders in the futures market.

Netflix Rolls Out Generative AI Tools to Fix the Content Overload Problem It Created
Netflix is rolling out generative AI tools like voice search and mood-based picks to help subscribers beat content overload and find shows faster.

Netflix’s Underperforming Stock Needs a New Story. It Can’t Be AI.
Netflix's stock has been underperforming for a year now. The company needs to come up with a new story to win over markets.
/AI%20(artificial%20intelligence)/AI%20software%20engineering%20by%20Tapati%20Rinchumrus%20via%20Shutterstock.jpg)
Wall Street Predicts GitLab Stock Will Soar 110%. Here’s Why.
GitLab's AI ambitions and strong enterprise demand have analysts forecasting massive upside ahead.

SpaceX IPO, CPI Report and Other Can't Miss Items this Week
Markets face a pivotal week marked by a significant structural shift away from richly valued AI and technology stocks toward lagging sectors, evident in...
/2d%20illustration%20of%20Cloud%20computing%20by%20Blackboard%20via%20Shutterstock.jpg)
There’s Still Time to Invest in Lumentum’s Optical Networking Momentum
Lumentum is benefitting after Nvidia's CEO complimented Marvell in the networking space.
/Technology%20by%20Alexandre%20Debieve%20via%20Unsplash-2.jpg)
Rumble Shakes Up the Cloud Space with Massive Blackwell Commitment
Rumble partners with Nvidia with a $270 million commitment for their Blackwell GPUs.
/Alphabet%20(Google)%20Image%20by%20Markus%20Mainka%20via%20Shutterstock.jpg)
Google Stock Fell on CapEx Plans. Don’t Miss the Silver Lining in Berkshire Hathaway’s Big Bet.
The AI race is getting more expensive, and Alphabet’s latest fundraising plan proved it. Still, Berkshire Hathaway’s $10 billion bet offers investors...
Are US Cattle Screwed - Again?
As spring turns to summer, US beef headlines have announced the return of the New World Screwworm.