
- This being another Monday, naturally there is already chatter regarding the next round of NASS' make-believe weekly crop condition numbers.
- After I talked last week about how NASS' numbers go down as crops mature or turn brown, there was the usual cacophony of voices saying, “Traders trade them!”
- Do they though? And if they do, my studies have long shown it may not be how these folks think.
No sooner had I posted last week’s piece on NASS’ made-up weekly crop condition numbers and the Browning Effect when the usual chorus of “Yeah but traders trade them!” could be heard. Okay, I get it. The first thing that came to mind is the old flat earthers who just knew they were right because every ship that sailed over the horizon was never seen again. Presumably. Yet somehow those ships usually came back. In time.
In response, I will post another set of charts that I’ve been happy to share with the folks at NASS, and their many apologists, for as long as I remember. Before we get into this discussion, though, let’s go over a few things:
- If traders trade based on NASS’ made-up numbers, the assumption is as crop conditions go down prices should go up.
- With this in mind and given the Browning Effect shows NASS’ crop condition numbers go down as crops mature or turn brown, then prices of new-crop futures contracts should trend up.
- If so, then we would see a strong negative correlation between NASS’ numbers and futures prices.
- And as the old saying goes, correlation does not show causation, but it’s fun to talk about at times.
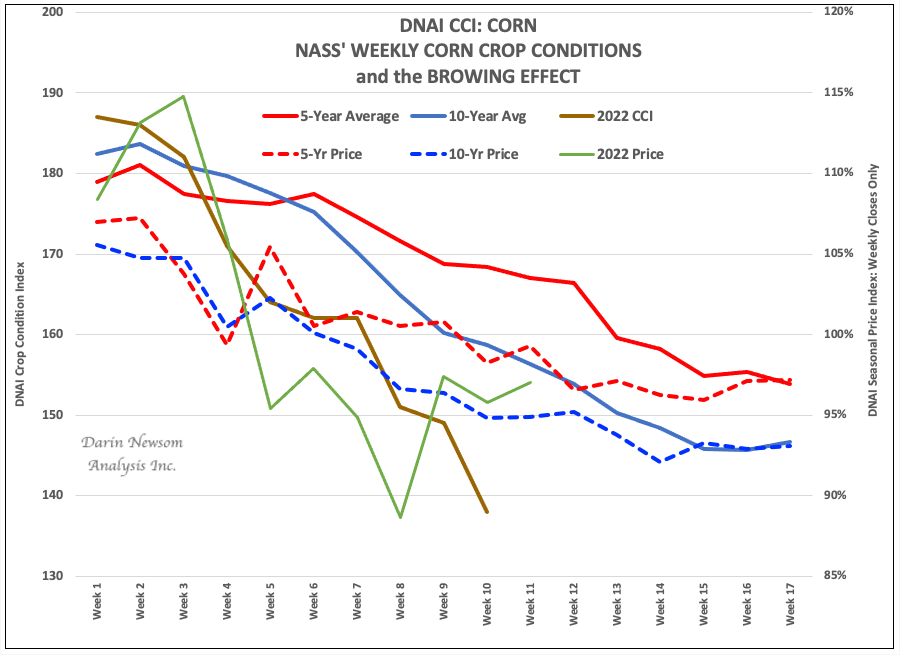
Okay, now that all that is cleared up, let’s take another look at corn and soybeans, starting with December corn (ZCZ22). Yes, the chart is a bit muddled with lines, but I’ll explain them to you. On this chart we see the same 2022 conditions (brown line) compared to the 5-year average (solid red line) and 10-year average (solid blue line). But I’ve also added weekly futures closes (indexed rather than flat price) for 2022 (green line), the 5-year average (dashed red line), and 10-year average (dashed blue line). If we pay more attention to the 5-year and 10-year averages, both conditions and futures prices, what do you see?
Here's what I see: The move together. Or in other words, as the Browning Effect plays out and NASS’ numbers come down, Dec corn’s futures price shows a seasonal tendency to move lower as well. Interesting, right? Let me add the correlation between the 5-year averages (red lines) is 84% while the 10-year averages come in at 97%. Think about that for a moment. Nearly 100% on the 10-year, in the same direction, indicates traders may indeed be trading NASS’ numbers, but on the idea the weekly updates are completely wrong. I find that interesting and adding to the intrigue that USDA doesn’t even use the numbers in its monthly supply and demand silliness.
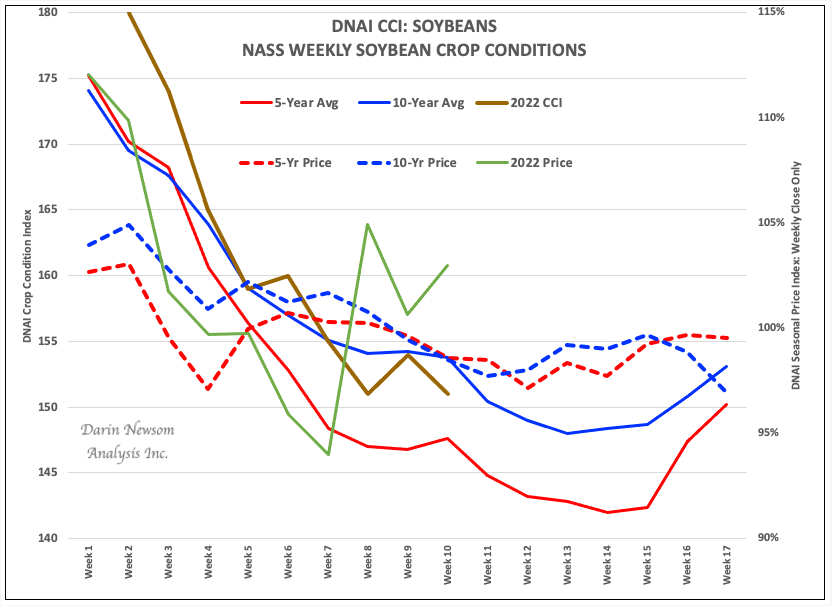
But what about November soybean (ZSX22)? Surely that market shows how valuable NASS’ nonsense is, right? No, and don’t call me Shirley (thank you Leslie Nielsen). Here we see the ties that bind aren’t quite so tight, though general condition trends and price trends move the same direction. The 5-year averages show a correlation of 64% while the 10-year averages come in at 85%, again indicating traders are far more apt to view NASS’ weekly updates as absolutely incorrect.
So, as the hue and cry begins to grow today for the next round of ridiculousness, what should we keep in mind:
- Repeat this mantra: Crop conditions go down as crops turn brown, and
- There are three types who tell you how important these numbers are:
- Some are trying to sell you something
- Some are trying to get you to trade
- and some simply have time or space to fill with imaginary news
Now, I am truly done talking about this nonsense for another year. It’s time to turn our attention to other fun subjects, like China.
More Grain News from Barchart
/A%20concept%20image%20showing%20a%20lightbulb%20with%20planet%20earth%20in%20a%20mossy%20green%20background%20by%20Capt_Pic%20via%20Shutterstock.jpg)

/The%20CrowdStrike%20logo%20on%20an%20office%20building%20by%20bluestork%20via%20Shutterstock.jpg)

/An%20image%20of%20a%20Tesla%20humanoid%20robot%20in%20front%20of%20the%20company%20logo%20Around%20the%20World%20Photos%20via%20Shutterstock.jpg)