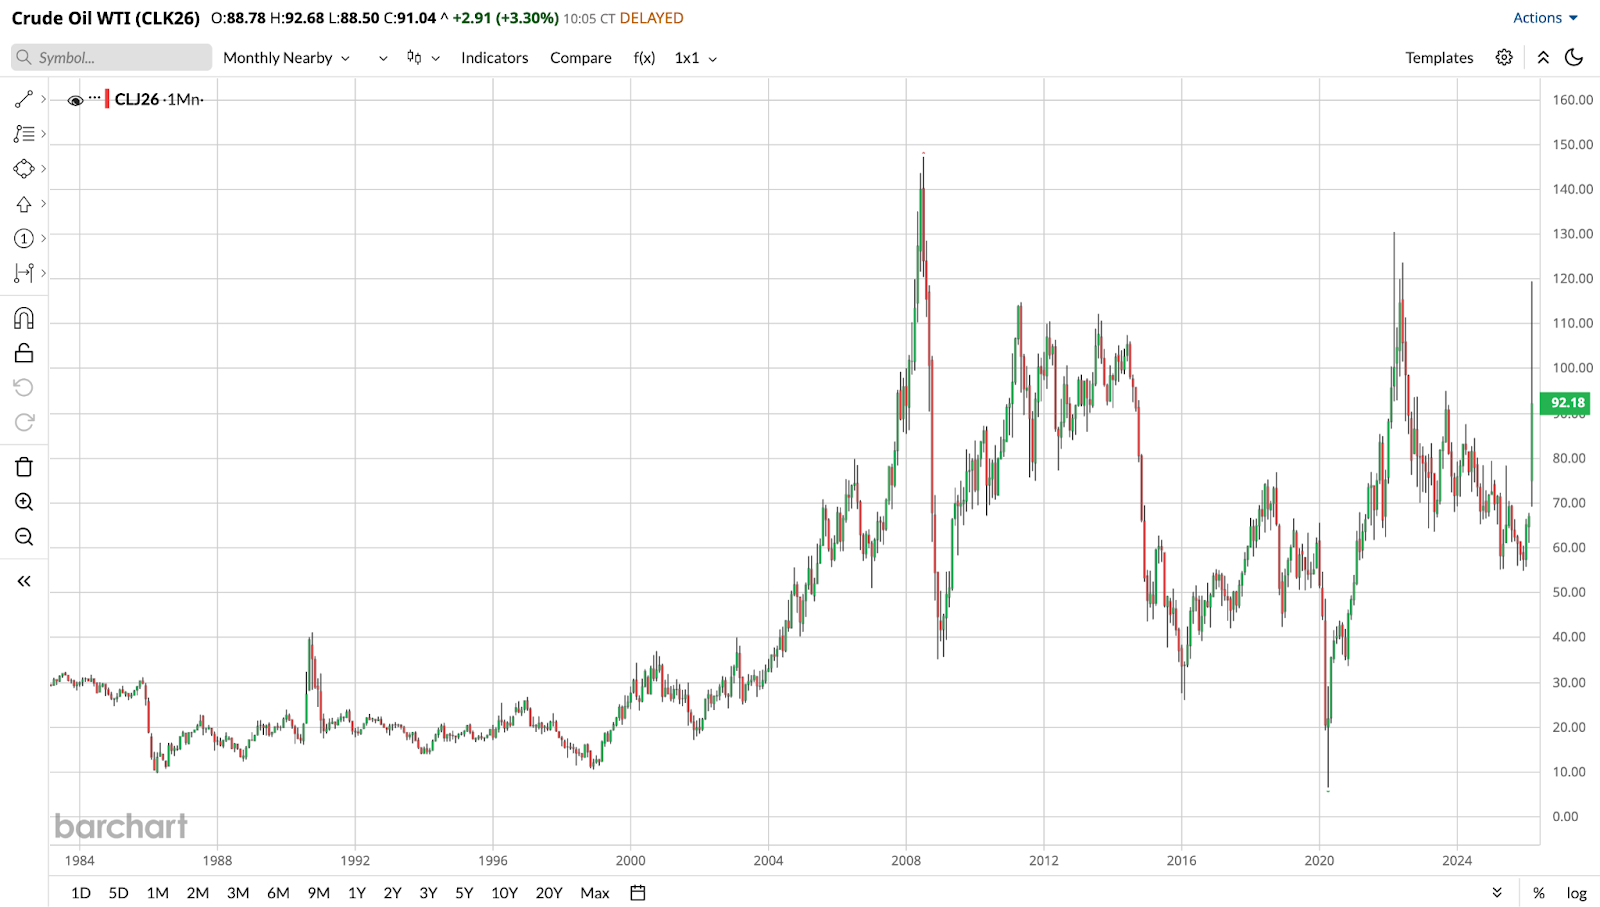
History has a way of repeating itself in the financial markets, often using the same catalyst: the price of a barrel of crude oil (CBK26). As geopolitical tensions escalate, investors are looking nervously at their portfolios, wondering if we are witnessing the opening chapters of a familiar tragedy. In July 2008, oil prices spiked to a staggering $147 a barrel. Just 60 days later, the stock market began a historic collapse. Given that the Iran war commenced on Feb. 28, the clock may be ticking once again.
The relationship between energy costs and equity performance is rarely a coincidence. While the Great Recession of 2008 was primarily driven by the housing crisis, record-high oil prices acted as a final, unsustainable weight on the global economy. When oil prices reach levels that consumers simply cannot sustain, a massive economic correction becomes inevitable.
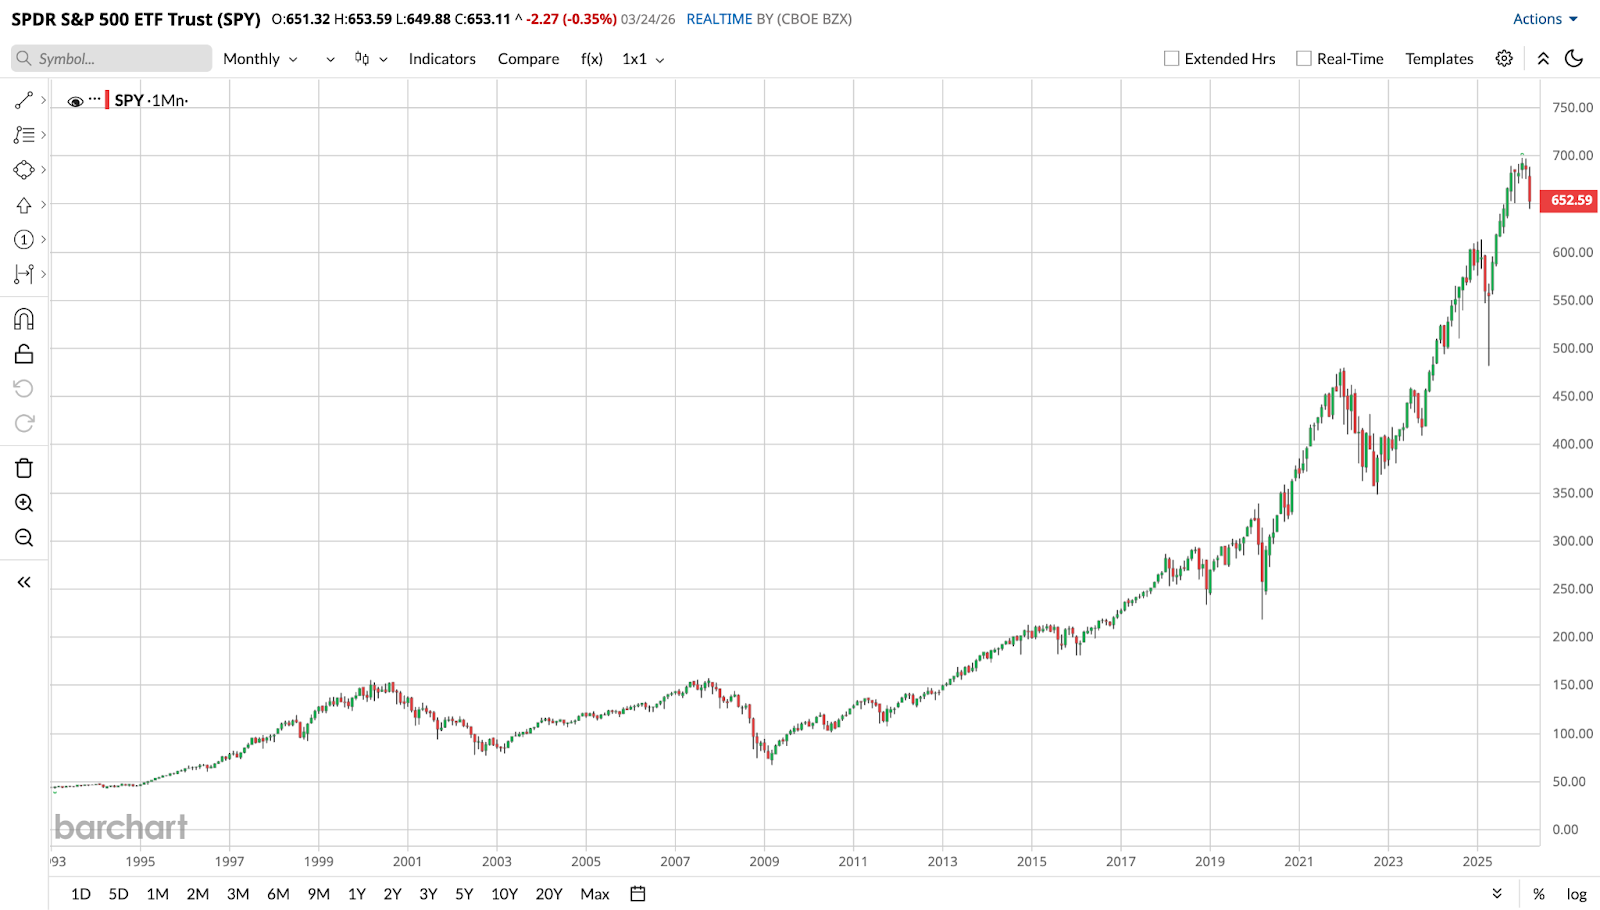
The market recently endured a similar version of this. The most significant spike in oil before the current Iran war surge occurred in 2022. That year, the market endured a prolonged bear market due to the energy shock. A side-by-side comparison of S&P 500 ($SPX) charts and crude oil futures reveals a clear, inverse correlation: As the cost of energy climbs, the market tends to decline.
The Mechanics of a Downturn
Why does oil exert such pressure on the stock market? It comes down to basic liquidity and consumer behavior. When the cost of living surges due to rising energy costs, consumers require more capital to cover daily expenses. To adapt, many are forced to sell off investments to free up the cash needed to cover rising prices at the pump and in the supply chain.
Currently, the data is beginning to reflect this strain. Crude recently hit highs of nearly $115 per barrel, a level not seen since 2022. The S&P 500 has already slid nearly 6% from its all-time highs in recent months. Since the recent oil peak, the broader market has seen a decline of roughly 4%. While these figures aren’t as daunting as the losses sustained in 2008 and 2022, it has only been about a month since the war began, and the recent downside could be a sign of more to come.
Despite these warning signs, it is vital to distinguish between a "looming downturn" and a guaranteed recession. While oil spikes are reliable identifiers of trouble, they rarely act alone.
In 2022, the bear market was fueled by a mix of high inflation, aggressive interest rate hikes by central banks, and severe supply chain constraints. Today’s landscape is more nuanced. We are currently seeing moderating inflation and lower interest rates compared to the 2022 peak. Furthermore, while the Strait of Hormuz is effectively closed to vessels supporting specific factions, which is creating a localized supply constraint, the broader global market has not yet experienced the total systemic breakdown seen in previous crises.
The Geopolitical Decider
The primary driver of the current price surge is undeniably the Iran war. With geopolitical relations in shambles and no immediate signs of the conflict slowing down, the energy market remains in a state of high sensitivity.
If history follows the 60-day rule established in 2008, the window for a major market correction is narrowing. Whether the current moderating inflation and interest rate environment can buffer the blow of $115 oil remains the $147-a-barrel question. For now, investors must decide if the current market slide is a temporary dip or the beginning of a sustained bear market fueled by a world at war.
On the date of publication, Oscar Cierpial did not have (either directly or indirectly) positions in any of the securities mentioned in this article. All information and data in this article is solely for informational purposes. For more information please view the Barchart Disclosure Policy here.

/Micron%20Technology%20Inc_%20logo%20on%20building-by%20vzphotos%20vis%20iStock.jpg)
/Dell%20Technologies%20by%20Poetra_RH%20via%20Shutterstock.jpg)

