
- With May option expiration coming up at the end of this week for grains and oilseeds, the conversation around selling covered calls against long corn positions will likely grow louder.
- There are a number of market filters the strategy needs to be run through first, beginning with market seasonality and volatility.
- The cmdty National Corn Price Index, the intrinsic value of the market, shows a seasonal pattern of rallying through the first week of June.
As I mentioned in Monday's Morning Commentary on my website, the corn market will be busy this week. I listed much of what is going on in the Commentary, but also want to point out this Friday is the expiration date for May options on futures. This could light a fire under the conversation of selling July (or June) call options against long positions in the market:
- Cash
- Futures, contracts that have been been or are in the process of being rolled from May to July
- Corn Exchange Traded Funds (ETFs) like Teucrium Corn (CORN)
- Corn market related stocks (e.g. John Deere (DE), CF Industries (CF), Mosaic (MOS), etc.)
The selling of call options would be considered covered sells, as opposed to selling naked options[i], bringing to mind The Speedo Situation[ii] that I often talk about when the subject of being short options comes up. I’m not saying it’s a bad strategy, we just need to understand it’s a limited reward/unlimited risk play that puts more emphasis on Newsom’s Market Rule #3[iii]. One of the filters we can use is Seasonal Analysis.
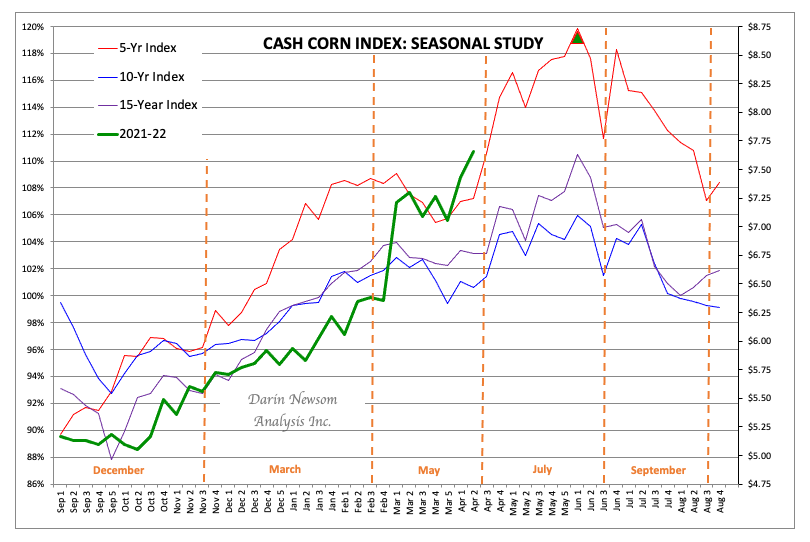
Here we see the seasonal weekly close-only chart (both the Goldilocks Principle[iv] and the Wilhelmi Element[v]) for the cmdty National Corn Price Index (ZCPAUS.CM), what I view as the intrinsic value of the corn market with the weeks of option expirations marked (dashed orange vertical lines). The NCPI finished last week calculated at $7.65, a new high weekly close for the 2021-2022 marketing year (green line). Note, though, the NCPI continues to follow its seasonal patterns relatively well (as corn likes to do), particularly the hotter (shorter-term) 5-year seasonal index (red line). On average, from last week’s calculation through the seasonal high weekly close the first week of June the NCPI tends to gain 13%. If the NCPI posts an average seasonal move this year it’s high weekly close would be projected at $8.65 (green triangle marker).
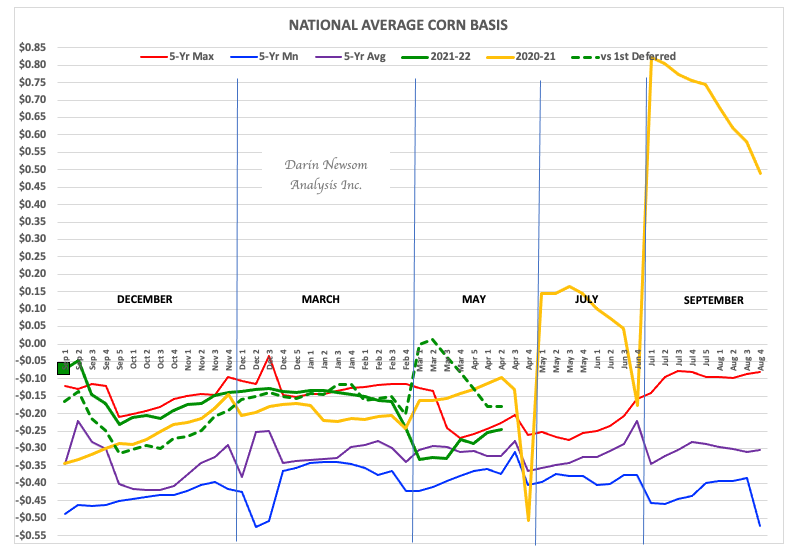
Additionally, the cmdty National Corn Basis Index (NCBI, weighted national average basis) shows a five-year average weekly close the first week of June of 32 cents under July futures, with a high previous 5-year weekly close of 25 cents under July. If we continue to see basis hold firm, and I expect it will, the upside target area for July futures the same first week of June would be $8.90 to $8.97. The July futures contract (ZCN22) was sitting near $7.91 early Monday morning.
Volatility is another key filter, and when it comes to trading options. The latest implied volatility reading for July corn is about 32.4%, a number that could be considered high but is actually well off its recent peak of 42.0% from early March. Here’s where things get a bit tricky, as volatility could go either way depending on if noncommercial traders view corn as overpriced historically or underpriced fundamentally.
The bottom line is based on seasonality, those looking to sell options against a long corn position could hold off for now, though be ready to make a move quickly given how overbought nearly all aspects of the market are at this time.
[i] You can find my discussion on this in my Weekly Column “Beware of the Naked Man” from November 19, 2018.
[ii] The Speedo Situation tells us being short options, like wearing a speedo in public, is not right for everyone.
[iii] Newsom’s Market Rule #3 says, “Use filters to manage risk.”
[iv] The Goldilocks Principle: Daily charts are too hot, monthly charts are too cold, but weekly charts are just right.
[v] The Wilhelmi Element: The only price that matters is the close.

/Intel%20Corp_%20logo%20on%20mobile%20phone-by%20Piotr%20Swat%20via%20Shutterstock.jpg)
/Amazon%20pickup%20%26%20returns%20building%20by%20Bryan%20Angelo%20via%20Unsplash.jpg)
