
When the 10th best performer is “only” up about 100% year to date, you know you are looking at a list of the very best. That’s what you see below.
Through last Wednesday, these were the 10 best stocks by year-to-date performance within the S&P 500 Index ($SPX). They range from 99% to 301%, with the average stock in the group returning… a lot of profits… to those who held throughout the year.
Sexy returns, eh? But is it a trap? Or, are some on this list bound to continue higher during 2026? I analyzed this group and found a few that look like the best “continuation” candidates of the bunch.

I created a watchlist (watch this video to learn how to create a watchlist of your own) of those 10, and examined the default fundamental table that Barchart.com provides. For technician/non-fundamental analyst types like me, that’s plenty of insight to identify outliers, and get a sense of what we’re dealing with. These are S&P 500 components, so screening within that set of stocks is one fundamental step out of the way. Stocks are selected to that list by the S&P committee, they don’t just make it based purely on size.
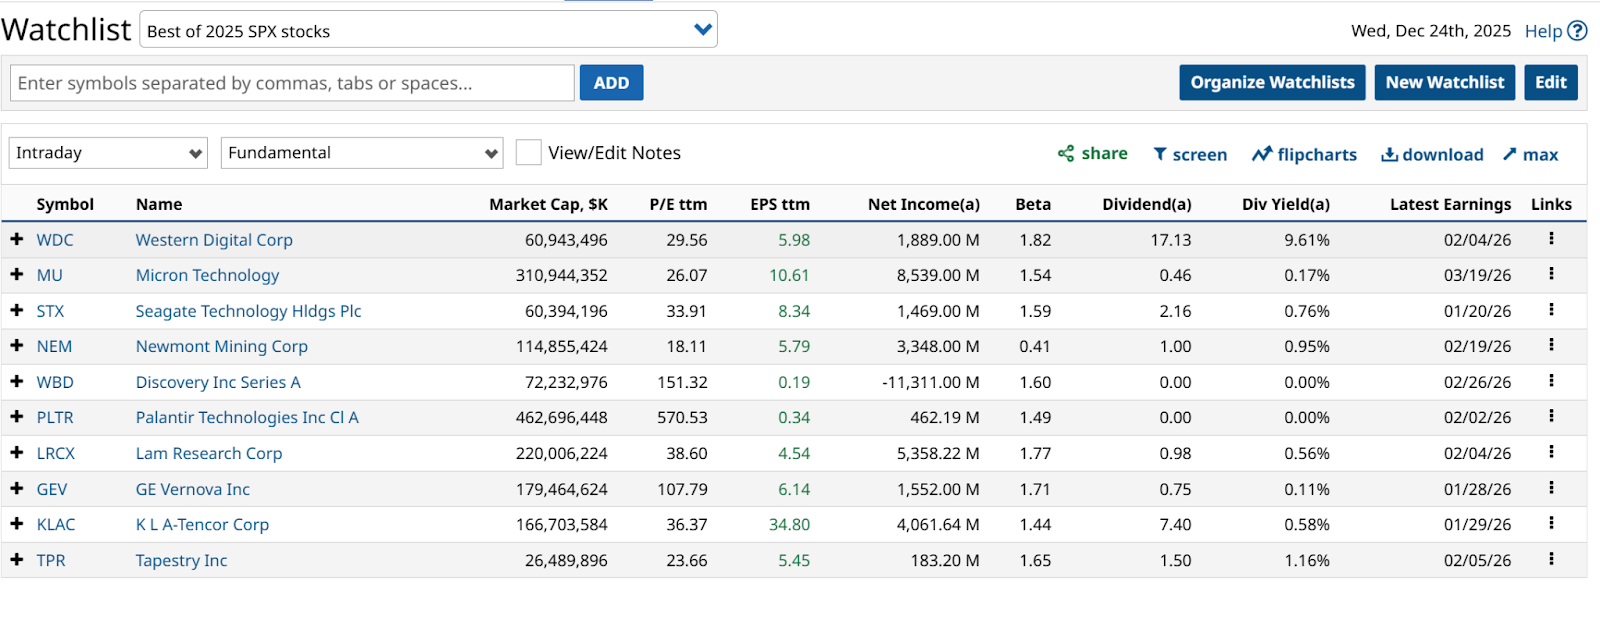
I was actually surprised and impressed that the trailing P/E ratios of seven out of the 10 were under 40x. And four of them were under 30x. I also note the beta column, where these have all exhibited much more volatility than the market itself.
Only the gold mining stock in the group is under 1.4x, and that is well below. However, that industry has moved up so much, we have to respect the fact that trees don’t go to the sky. Even if those trees are made of gold.
I would not think of these as a portfolio, unless I were hedging it within the tech sector. Seven of the 10 come from there, along with a retail name and an energy stock, as well as the gold miner.
So for me, it all comes down to the charting. I went through all 10, with the goal of finding the three I thought had the best return/risk tradeoff. In other words, the chart has not only indicated a good chance of further gains in the new year, it can’t look vulnerable to a sudden price plunge.
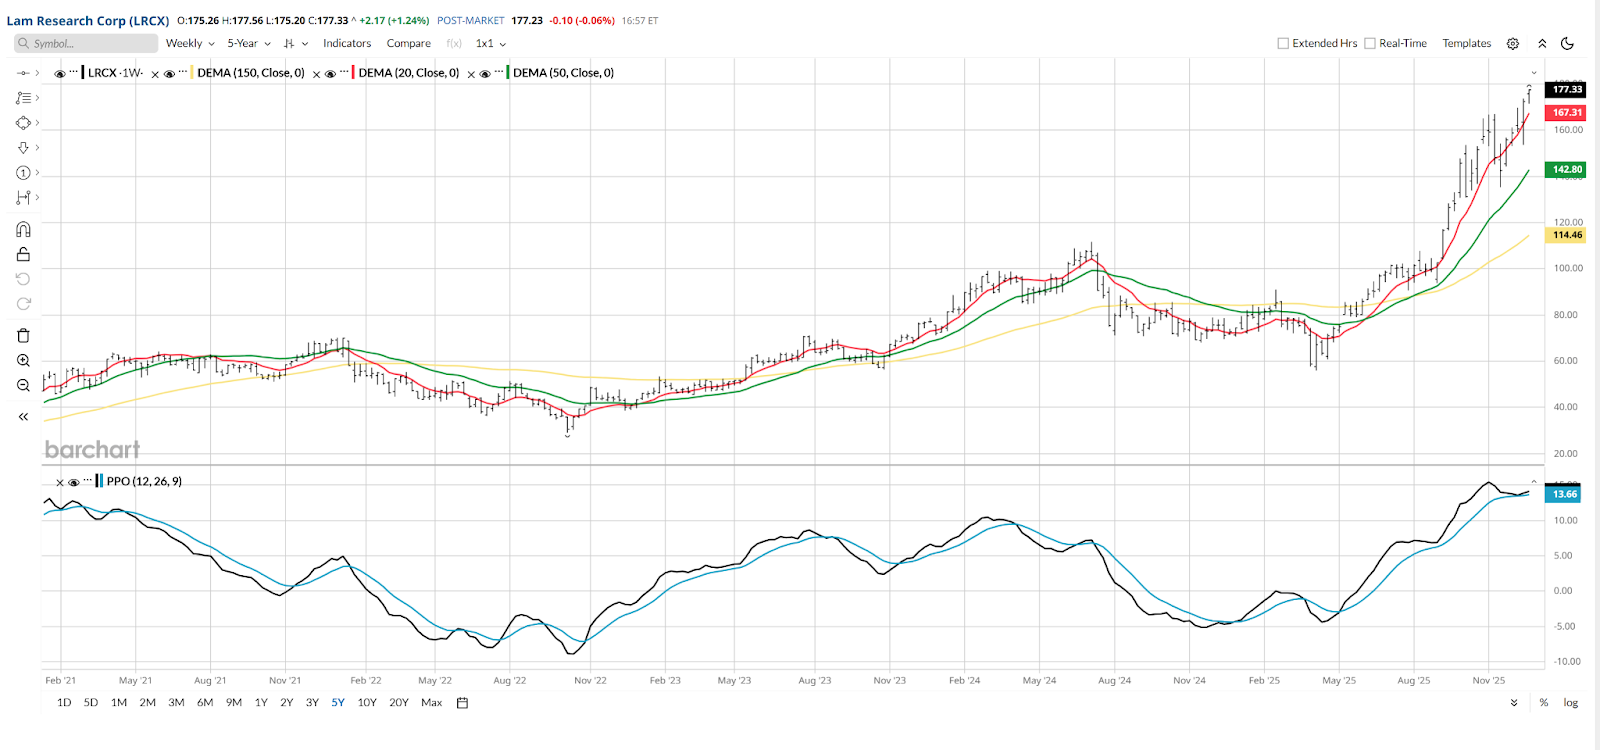
And as we see in the previous table, these stocks will start announcing earnings in a few weeks. Expectations are high, given the big price moves in 2025. Here are the three charts that looked best to me. I used a weekly chart view, so as to look beyond shorter-term air pockets. In a weekly view, that’s less likely to bust the chart pattern, at least not right away.
Which of 2025’s Tech Stock Winners Will Keep Profiting in 2026?
Here’s one of the tech stocks, KLA (KLAC). As with the sector in general, late 2025 has seen a recovery of the sharp dip, and these stocks may now be poised to start the new year by resuming runs through new highs. The 20-week moving average is often a strong signal, and it has been unwavering.

Same idea below. Lam Research (LRCX) has practically the same chart as above. More evidence of what I’ve been writing about here, in that the stock market gets more correlated by the week.
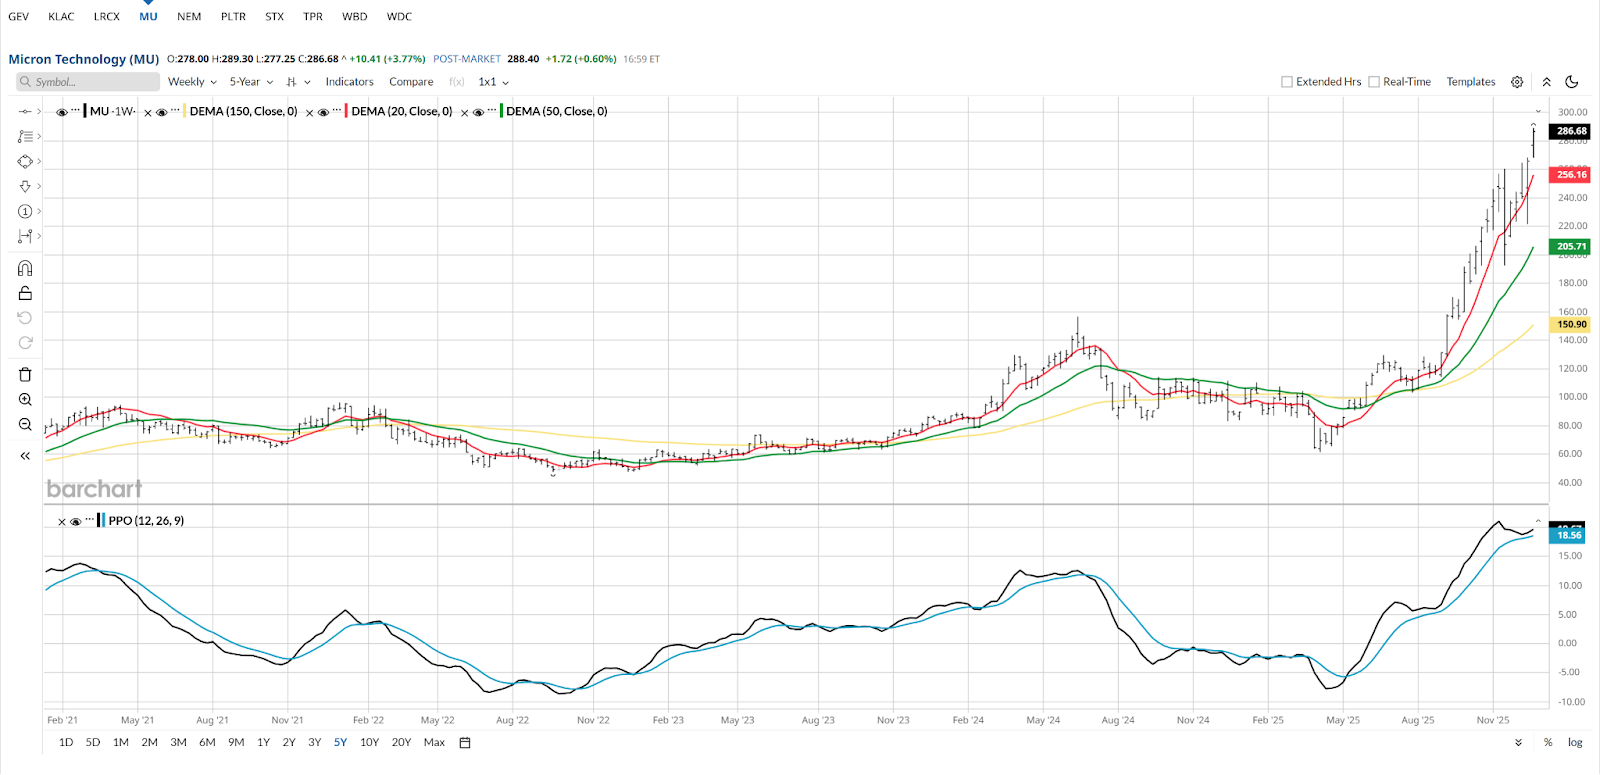
And lastly, Micron Technology (MU) has had strong news flow in its favor. I’m not an investor who just assumes a stock will go higher after zooming up like this one. But I’ll say this: The more tech stocks that continue higher to start 2026, continuing these strong patterns from 2025, the more likely we are headed toward a year-2000 rise and fall redux.
What happened then? The Nasdaq-100 Index ($IUXX) completed a 75% runup in under a year, and promptly fell 75% to follow that. As investing math works, that sequence of returns leaves the investment well below where it started.
To be clear, none of these charts look anything close to low risk and undervalued. How could they after doubling, tripling or quadrupling in the last 12 months, even with the March-April market hiccup? And all I chose to show here have similar-looking charts: Strong bull trends that will continue until they don’t. The question is how much will they react downward when they do, and how quickly will they recover? We’ll see in 2026.
Rob Isbitts, founder of Sungarden Investment Publishing, is a semi-retired chief investment officer. For more of Rob’s research and investor coaching work, see ETFYourself.com on Substack. To copy-trade Rob’s portfolios, check out the new Pi Trade app.
On the date of publication, Rob Isbitts did not have (either directly or indirectly) positions in any of the securities mentioned in this article. All information and data in this article is solely for informational purposes. For more information please view the Barchart Disclosure Policy here.
/Microsoft%20headquarters%20By%20Peter.jpeg)
/NVIDIA%20Corp%20logo%20outside%20building-by%20BING-JHEN_HONG%20via%20iStock.jpg)
/Micron%20Technology%20Inc_%20logo%20on%20building-by%20vzphotos%20vis%20iStock.jpg)
/Amazon%20-%20Image%20by%20bluestork%20via%20Shutterstock.jpg)
