Overview
(ZSF26) (ZCZ25) (ZWZ25) (LEZ25)
Following the ONE44 rules and guidelines for the Fibonacci retracements we know that any market that is going to keep its current trend will stay above/below a 38.2% retracement and when really strong/weak a 23.6% level. You will know the short term trend changes when it starts to hold those same retracements in the other direction.
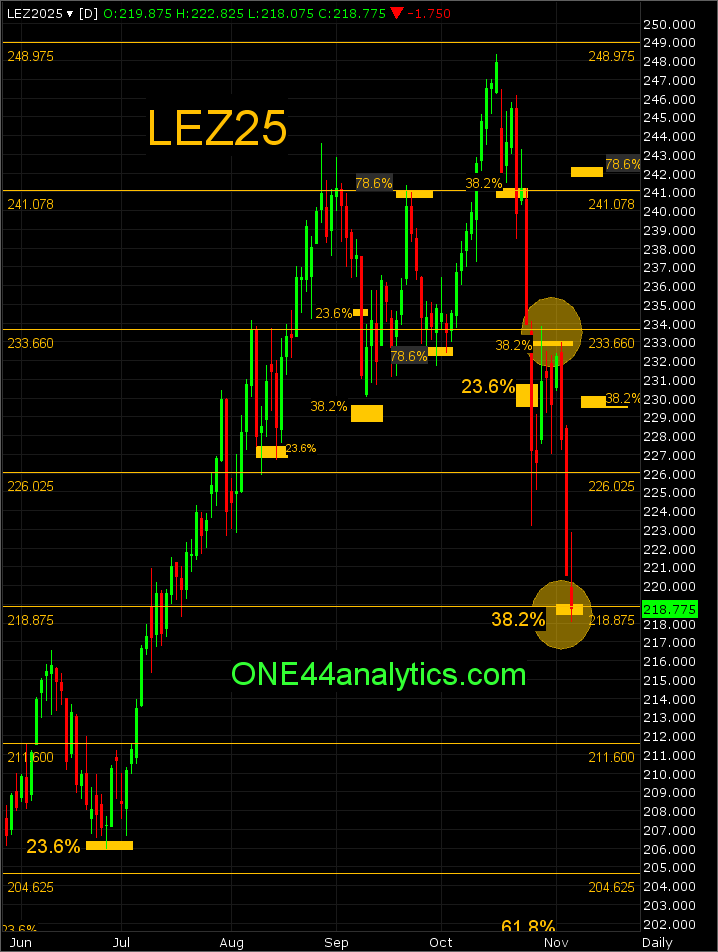
In Cattle the year long rally held 23.6%, or 38.2% on every setback until the high on 10/16/25. It then fail to hold retracements below, the first sign of a trend change and then this week the high hit 38.2% back to that high at 232.85, what followed is a $12.00 break so far.
It has now hit our long term target and swing point.
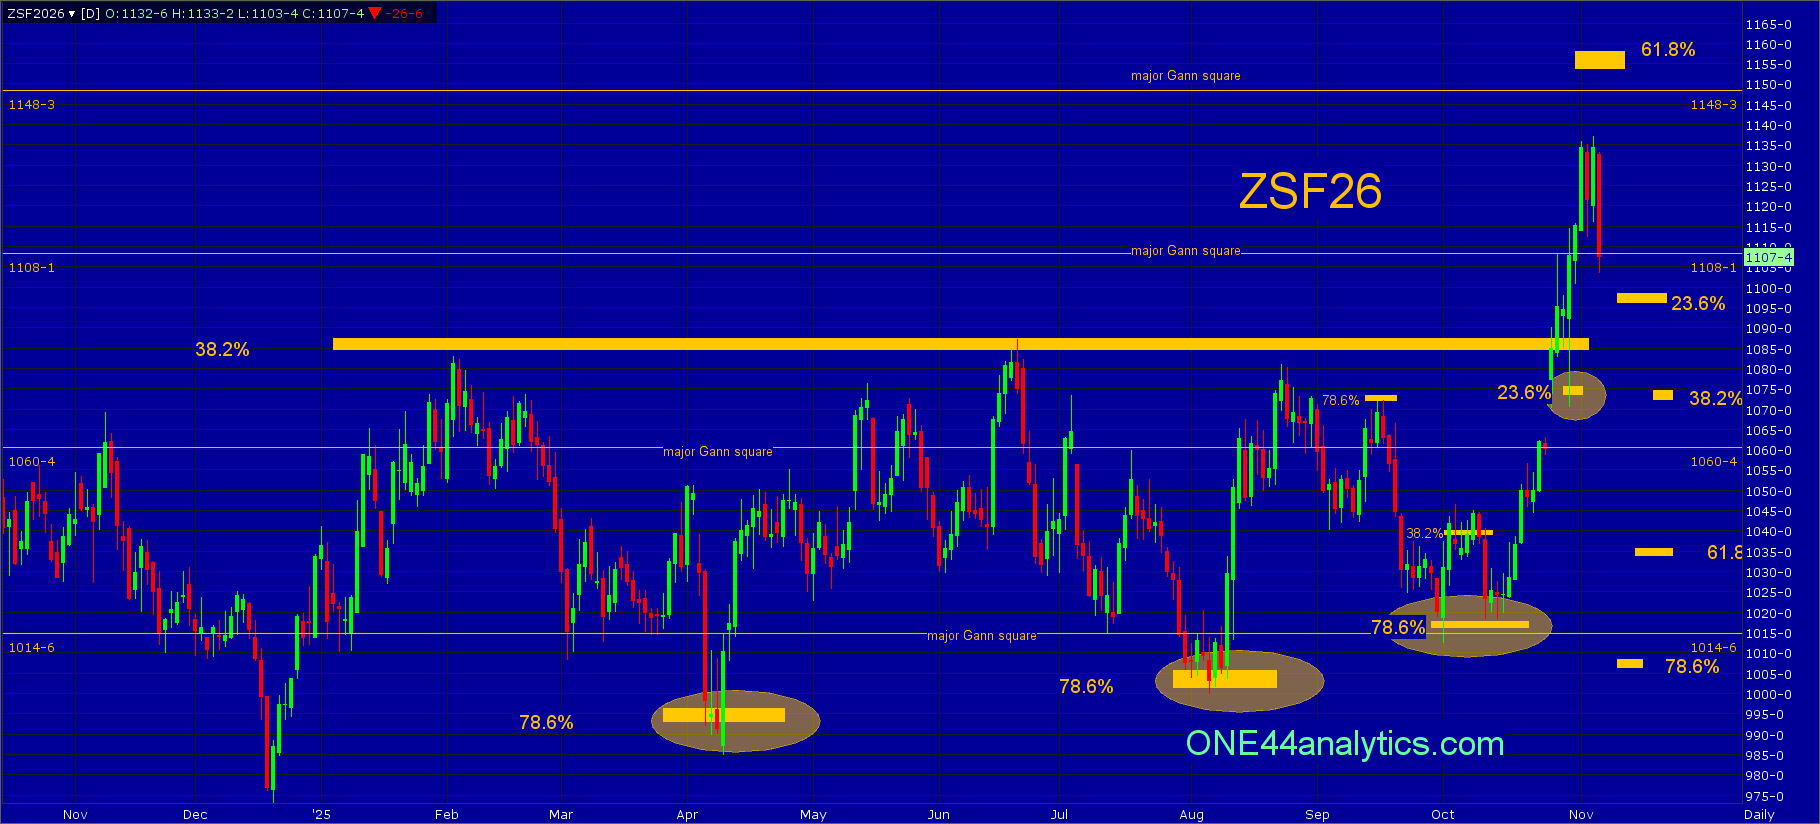
January Soybeans traded sideways for the better part of a year below 38.2% at 1084.00. In that time it held a 78.6% retracement 3 different times, once on 4/9/25, the failure to make a new low in the area of a 78.6% retracement after hitting a 38.2% retracement above was the first sign that the break should be over. Usually this is enough to send the market on a new Bull run, however it setback two more times from the 38.2% level (1084.00) and both of those setbacks held a 78.6% retracement on 8/6/25 and 10/1/25. It broke out of the trading range last week and our swing point was 1076.00 (23.6%), by holding this level it kept the short term trend positive and it has rallied 60 cents so far.
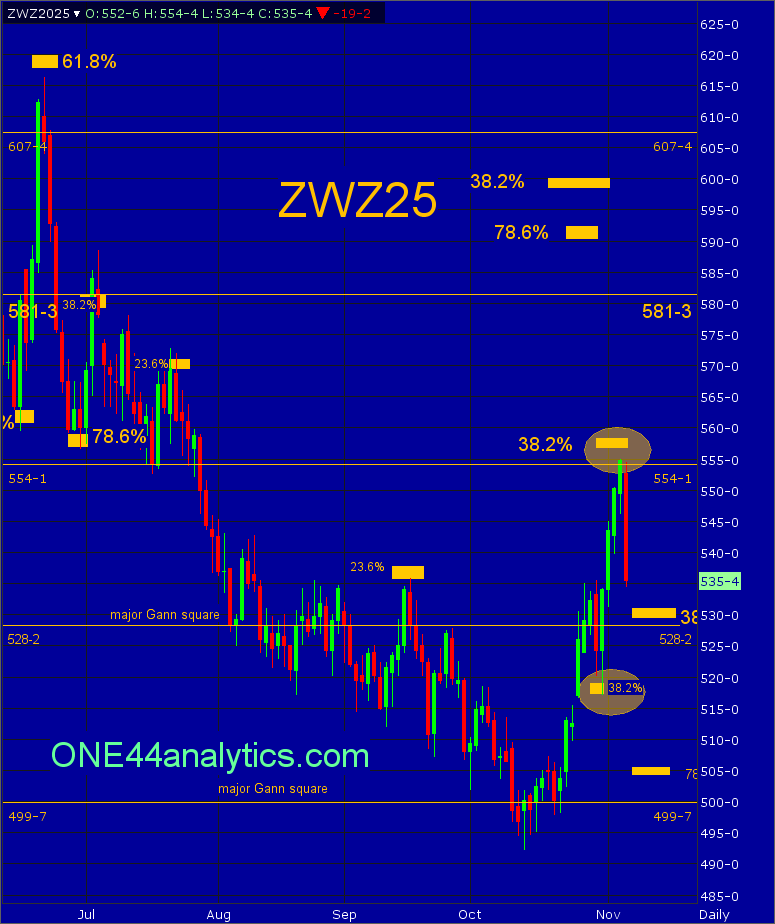
For Wheat the low for the week held 38.2% back to the 10/14/25 at 519.00, holding this level was the first sign the short term has changed and it has rallied 35 cents at this point and hit our short term target area of the 554.00 major Gann square and 38.2% back to the 2/19/25 high at 557.00.
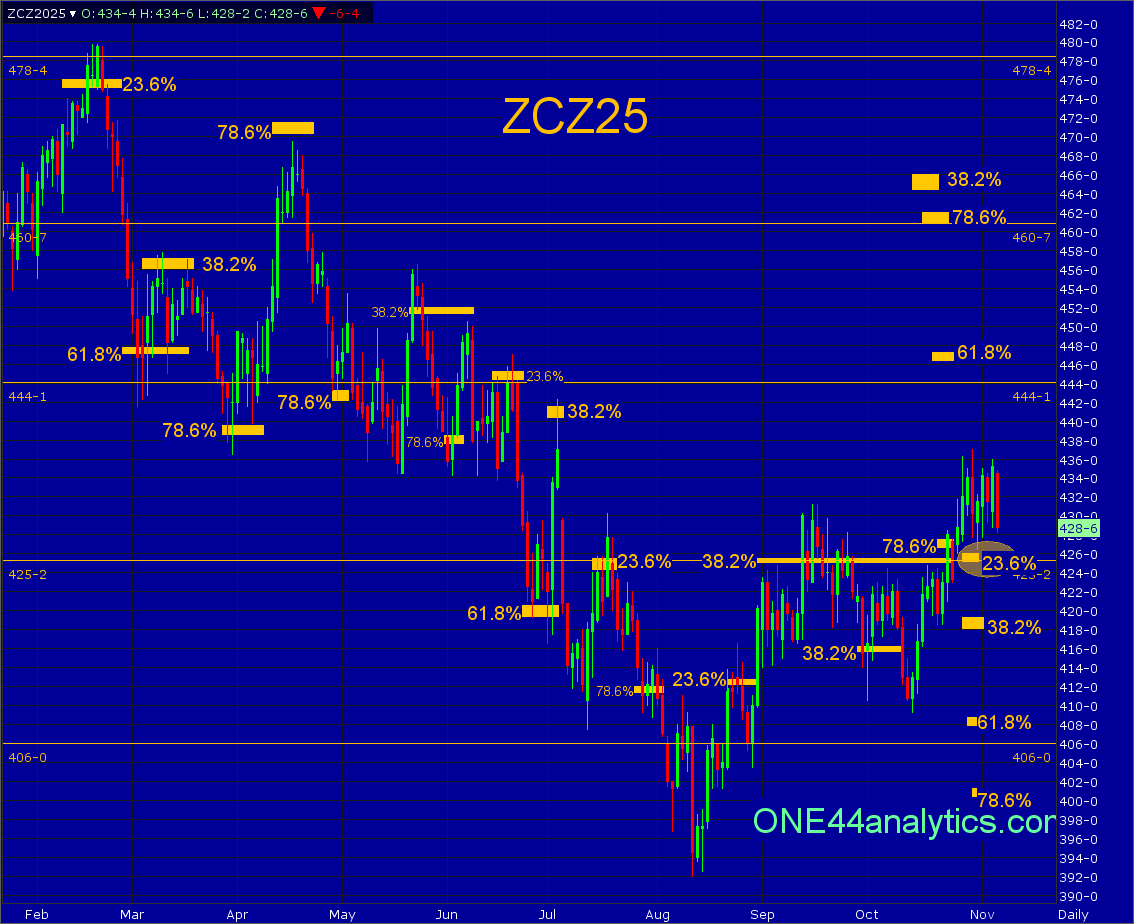
Corn has had another small range for the week, however it finally took out a 38.2% retracement above at 425.25 (also a major Gann square) and this week held above 23.6% (426.00), this was the swing point for the week. It remains a key level for the next week too.
Become a Premium Member today and get all the key levels before they happen.
ONE44 Analytics where the analysis is concise and to the point
Our goal is to not only give you actionable information, but to help you understand why we think this is happening based on pure price analysis with Fibonacci retracements, that we believe are the underlying structure of all markets and Gann squares.
If you like this type of analysis and trade the Grain/Livestock futures you can become a Premium Member.
You can also follow us on YouTube for more examples of how to use the Fibonacci retracements with the ONE44 rules and guidelines.
FULL RISK DISCLOSURE: Futures trading contains substantial risk and is not for every investor. An investor could potentially lose all or more than the initial investment. Commission Rule 4.41(b)(1)(I) hypothetical or simulated performance results have certain inherent limitations. Unlike an actual performance record, simulated results do not represent actual trading. Also, since the trades have not actually been executed, the results may have under- or over-compensated for the impact, if any, of certain market factors, such as lack of liquidity. Simulated trading programs in general are also subject to the fact that they are designed with the benefit of hindsight. No representation is being made that any account will or is likely to achieve profits or losses similar to those shown. Past performance is not necessarily indicative of future results.
/A%20Palantir%20office%20building%20in%20Tokyo_%20Image%20by%20Hiroshi-Mori-Stock%20via%20Shutterstock_.jpg)
/Nvidia%20logo%20and%20sign%20on%20headquarters%20by%20Michael%20Vi%20via%20Shutterstock.jpg)

/Apple%20products%20arranged%20on%20desk%20by%20tashka2000%20via%20iStock.jpg)