I asked why gold was stuck in neutral in a June 2, 2026, Barchart article, when I wrote:
Gold’s consolidation range is likely due to the correction after the parabolic price action ran out of upside steam, as well as the crude oil rally and the geopolitical situation that have driven interest rates and the dollar index higher. Higher rates increase the cost of holding gold positions, while a stronger U.S. currency typically weighs on gold and other precious metals.
Nearby COMEX gold futures were trading around $4,488 per ounce on June 1, 2026. Since then, they fell to a lower 2026 low but continue to consolidate above $4,000 per ounce.
The short-term bearish trend continues in gold
Gold reached its latest all-time high in late January 2026 and has made lower highs and lower lows over the past months.
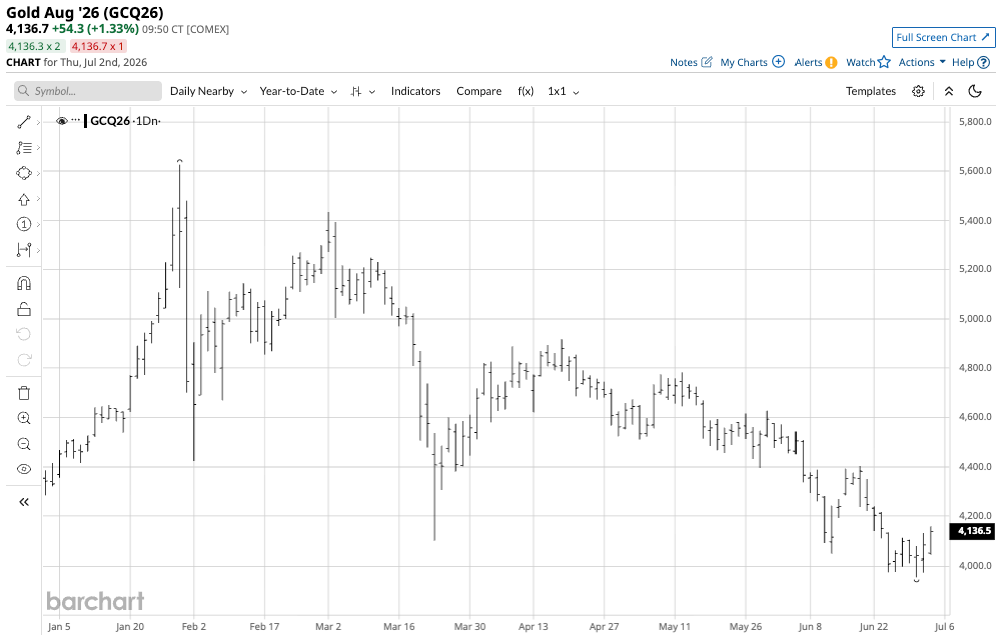
The year-to-date continuous daily COMEX gold futures chart shows that gold reached a spike low of $4,100 per ounce on March 23, held and recovered, then fell to a lower low of $3,955.40 per ounce on June 30. At $4,136.70 in early July, gold remains near its low and under pressure. A stronger dollar and elevated interest rates remain bearish for the leading precious metal.
The long-term bullish trend remains firmly intact, but there is downside risk
Meanwhile, gold’s long-term path of least resistance remains very bullish.
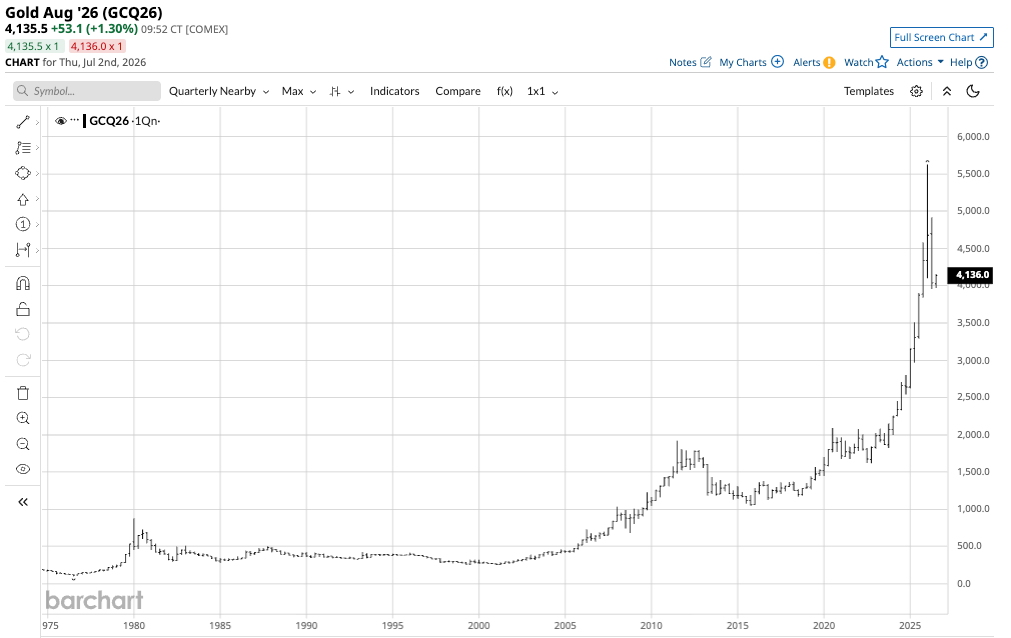
The quarterly chart shows that gold’s bull market began in 1999 at around $250 per ounce. While the trend is bullish, there is plenty of room for further correction. Below the psychological $4,000 level, the Q4 2025 low of $3,842.80 is the first long-term technical support. Below there, the next downside support is near $3,500 per ounce.
If gold follows the path of the last 27 years, it will not test the first support level. However, $3,842.80 is about $300 below the current price, suggesting gold has plenty of room to frustrate the bulls.
Central bank activity supports gold’s role as the ultimate reserve asset
According to the World Gold Council, central banks resumed net gold purchases in April 2026, purchasing 19 metric tons. Poland was the leading buyer, with a 14 metric ton purchase, while China bought 8 tons. While Russia sold 6 tons in April, the Chinese and Russian statistics could be significantly understated.
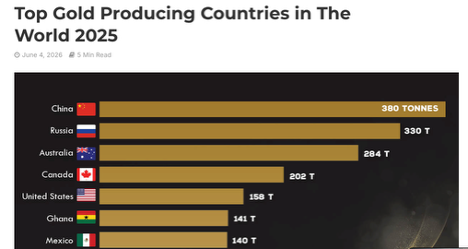
The chart shows that China and Russia were the top gold-producing countries in 2025, with a combined 710 metric tons, which is over 19% of the total mine production of 3,672 metric tons. China and Russia consider their gold and other commodity reserves national security secrets, so it is likely they have vacuumed in domestic production, increasing reserves more than the published statistics. While the U.S. dollar remains the world’s reserve currency held by central banks, China and Russia are leading the way on de-dollarization due to U.S. sanctions, tariffs, and other factors. Therefore, the stated gold holdings for the two leading producing countries are likely understated.
Net central bank gold buying over the past years has only validated and increased gold’s role in the global financial system.
Gold could take its time before making a move, which is healthy in a long-term bull market
Even the most aggressive bull markets rarely move in straight lines. Periodic corrections, which can be violent and shake the confidence of even the most committed bulls, are typical. Gold’s parabolic price action in 2024, 2025, and the first month of 2026 ran out of bullish momentum. The correction should come as no surprise, as the price action had become overextended.
A healthy correction tends to take the price to a level where it settles into a consolidation pattern. Time will tell if $4,000 and even $3,500 per ounce can contain the current correction, which is ongoing in early July 2026. A consolidation pattern in which gold begins to trade within a narrowing range may frustrate gold bulls, but it could be healthy for the market and future price action, as it will give central banks time to accumulate more gold to increase their reserves.
Trading gold from the long side could be optimal- IAU and BAR are attractive trading tools
I favor a scale-down approach to buying gold, starting around the current level while leaving plenty of room to add on further price weakness. The bullish case for gold remains strong, with a long-term technical bullish trend, central bank buying, and de-dollarization. Moreover, rising debt levels that erode fiat currencies only support gold as it is the world’s oldest means of exchange. While governments can increase the money supply by issuing more legal tender, the only way to increase the gold supply is by extracting more from the Earth’s crust. In the future, the race to space could spur gold mining on other planets, but that is decades or even centuries away.
The most direct route for investing in gold is through the physical market for bars and coins. However, buying physical gold can involve premiums to the current price, while selling can involve discounts. Gold futures have a delivery mechanism, but require specialized accounts and margin requirements.
The oldest and most liquid gold ETF that holds physical gold bullion is the Gold SDPR (GLD), which began trading in 2004. At $378.70 per share, GLD had over $130.45 billion in assets under management. GLD trades an average of over 8.5 million shares per day and charges a 0.40% management fee.
The iShares Gold Trust (IAU) began trading in early 2005. At $77.62 per share, IAU had over $62.7 billion in assets under management. IAU trades an average of over 7.34 million shares per day and charges a 0.25% management fee.
The GraniteShares Gold Trust (BAR) began trading in August 2017. At $40.63 per share, BAR had over $1.36 billion in assets under management. BAR trades an average of over 269,000 shares per day and charges a 0.17% management fee.
GLD, IAU, and BAR are excellent ETFs that track the gold price, providing exposure to the commodity that is also a financial reserve asset. The expense ratios cover storage and insurance costs over time.
If gold can hold above $4,000 or $3,500 per ounce, the consolidation period can be very healthy for the market. I favor a scale-down approach to buying gold, leaving plenty of room to add on further price weakness. As mentioned in my June 2, 2026, Barchart article, analysts at the leading financial institutions remain bullish, calling for prices to rise to $6,000 per ounce or higher. However, none of these analysts saw the parabolic price action in 2024, 2025, and early 2026 coming, so their forecasts are not gospel. Gold could have more downside at the current price level, but an accumulation program that follows the central bank activity could be optimal in the current environment.
On the date of publication, Andrew Hecht did not have (either directly or indirectly) positions in any of the securities mentioned in this article. All information and data in this article is solely for informational purposes. For more information please view the Barchart Disclosure Policy here.


/AI%20(artificial%20intelligence)/An%20aerial%20view%20of%20a%20data%20center%20cooling%20system%20by%20Sepia100%20via%20Adobe%20Stock.jpeg)