I asked if gold was inexpensive in a May 5, 2026, Barchart article, where I concluded with the following:
Central banks and governments continue to validate gold as the ultimate reserve asset, as it has replaced the euro as the second-most-held reserve asset. As long as gold remains a top reserve asset, it will remain a store of value. I remain bullish on gold, but would leave room to add to existing long positions on further declines.
Nearby gold futures traded at $4,528.60 per ounce on May 4, 2026, and were slightly lower at below $4,490 on June 1, 2026. Gold is stuck in neutral, which could be a golden opportunity.
Range trading in gold since late March
After declining by 27.1% from the January 29, 2026, high to the March 23 low, COMEX gold futures moved into a consolidation pattern.
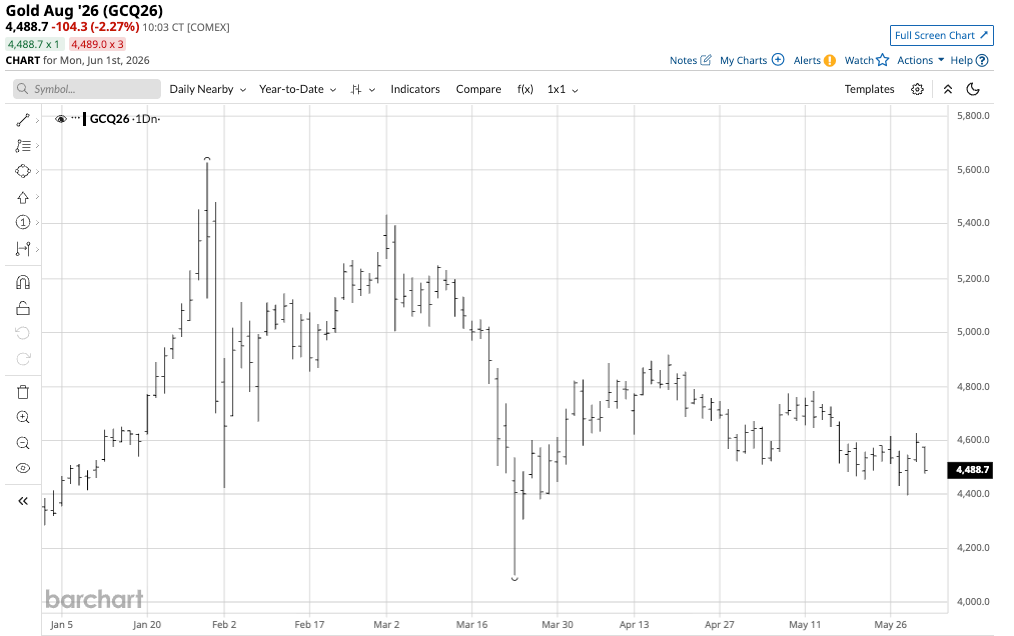
The year-to-date daily continuous gold futures chart shows that gold has traded from $4,396.50 to $4,917.70 since March 27, 2026. While gold is at the bottom of the two-month range, and the mostly bearish trend since the late January high reflects lower highs, the long-term bullish trend remains firmly intact.
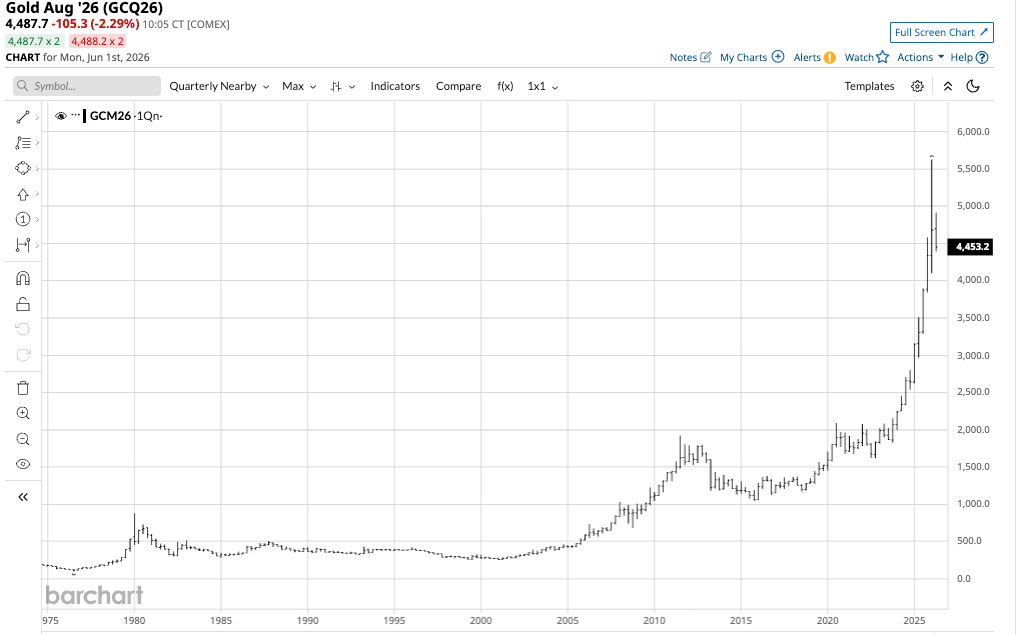
The quarterly continuous contract chart shows that gold remains in a bullish trend that began in 1999 and continues in mid-2026.
Gold’s consolidation pattern after the 27.1% correction has ended the parabolic rally that took it to an all-time high price in 2025 and early 2026.
Rising crude oil prices have been bearish; falling crude oil prices could ignite the next rally
Since early March, crude oil prices have exploded higher.
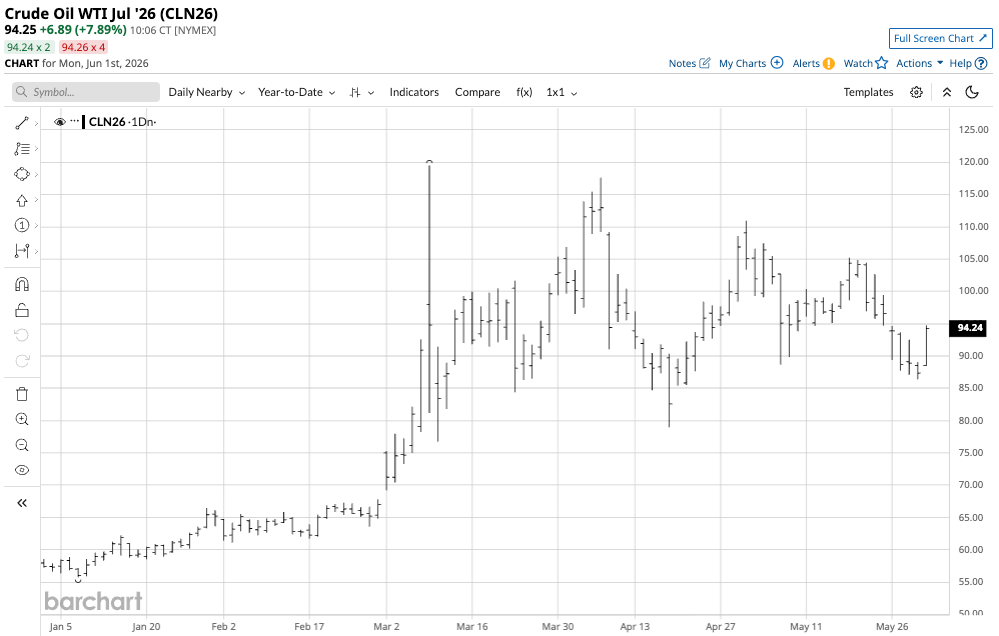
The continuous year-to-date NYMEX crude oil futures chart highlights the 114.3% rally that took the energy commodity from $55.76 on January 7, 2026, to a $119.48 per barrel high on March 9, 2026. Crude oil rallied after war broke out in the Middle East and the Strait of Hormuz, a critical logistical chokepoint for more than 20% of the world’s seaborne petroleum, shut down. While crude oil prices moved lower from the March 9 high, they have traded on either side of $100 per barrel in March through May.
Higher oil prices have increased inflationary pressures, and hostilities in the Middle East have led to some risk-off behavior in markets. Gold’s rally attracted buying from many investors, traders, and speculators. The explosive move in crude oil likely led to profit-taking in gold and other precious metals.
Gold’s consolidation range is likely due to the correction after the parabolic price action ran out of upside steam, as well as the crude oil rally and the geopolitical situation that have driven interest rates and the dollar index higher. Higher rates increase the cost of holding gold positions, while a stronger U.S. currency typically weighs on gold and other precious metals.
Central banks are net buyers, and analysts are bullish
According to Goldman Sachs, central banks continue to purchase gold to add to reserves at an average of 50 tons per month. Central banks and governments have been net buyers of gold for years, validating gold’s role in the global financial system and supporting its price. Central banks and governments classify gold as a foreign currency reserve asset, and rising gold prices have pushed it to the second-leading reserve asset, surpassing the euro.
Goldman Sachs is bullish on gold, with a year-end forecast that is $900 per ounce above the current price of $4,500 per ounce. However, Goldman is more conservative in its forecast than most of the leading financial institutions. JP Morgan Chase believes that gold will “climb toward $6,000 per troy ounce by the end of the year.” Bank of America is also calling for $6,000 per ounce, as is Citigroup in 2027. Meanwhile, Deutsche Bank and UBS are also calling for gold to move to $6,000 per ounce or higher. Morgan Stanley is the least bullish, but it is still calling for gold to rise to $5,200 from the current level of $4,500 per ounce.
The senior and junior gold mining ETFs could be sending a signal
At $4,490 per ounce, COMEX gold futures are over 20% lower than the late January 2026 all-time high. The VanEck Gold Miners ETF (GDX) holds shares of the leading senior gold mining companies.
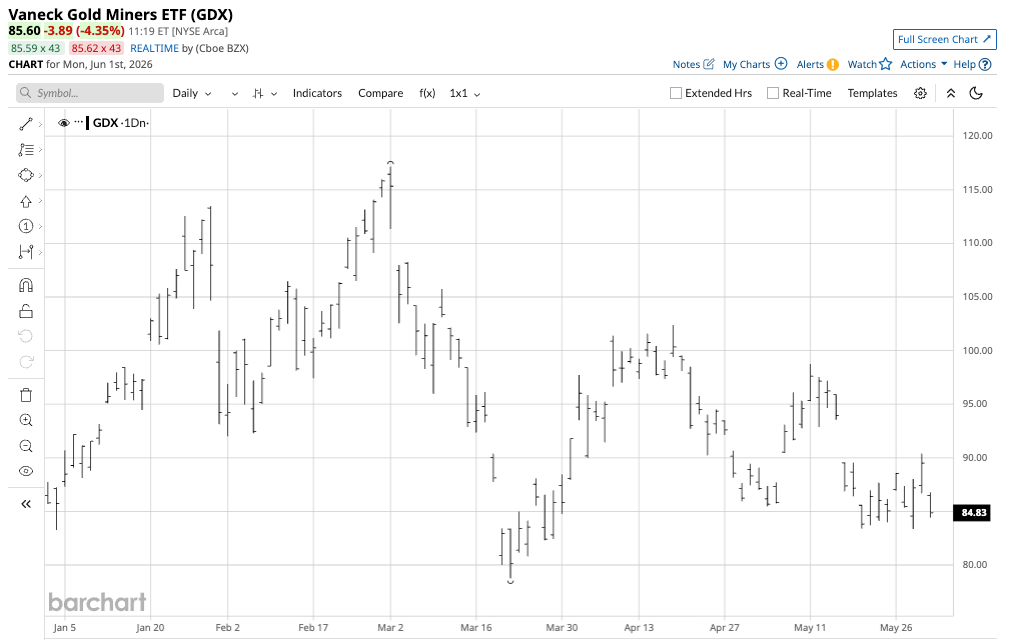
While gold reached its record high in late January, GDX rose to a record $117.17 per share in March 2026. At $85.60 per share in early June, GDX was 26.9% lower than its record high.
The VanEck Junior Gold Miners ETF (GDXJ) holds shares of the leading junior gold mining companies.
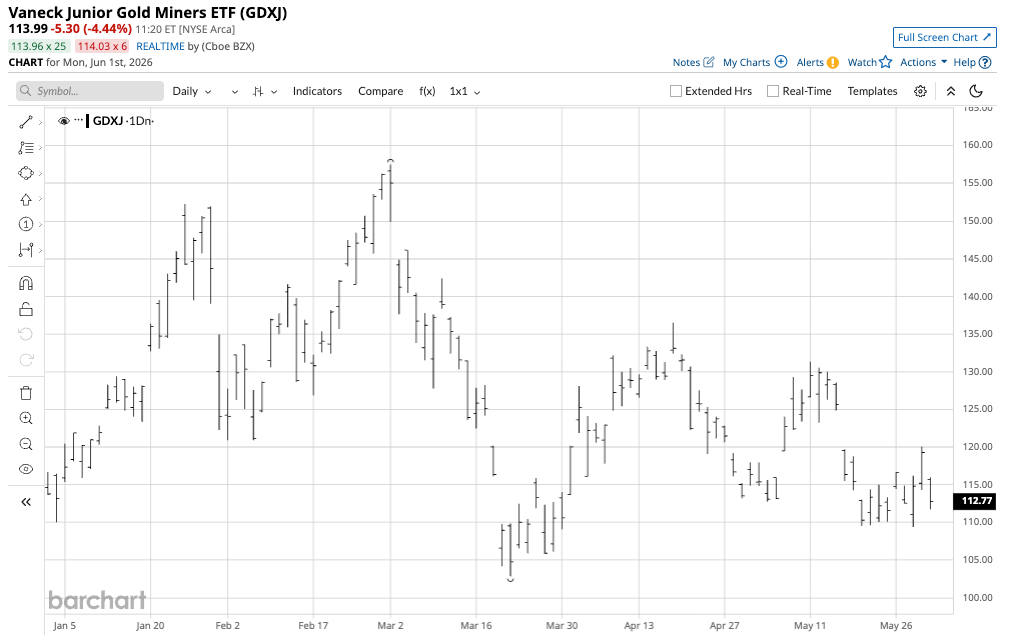
GDXJ rose to a $157.49 per share high in March 2026. At $113.99 per share in early June, GDXJ was 27.6% lower than its March high.
Senior and junior gold mining stocks tend to outperform gold futures on a percentage basis on the upside and underperform during corrections. GDX and GDXJ are highly liquid, diversified ETFs tracking senior and junior gold miners that outperformed gold from late January through early March but underperformed it from March through June. The price action in the gold mining shares signals less investor and speculative interest in gold in early June 2026.
Watch the mining ETFs for clues
The price action in gold and the GDX and GDXJ ETFs in 2025 displays the mining shares’ outperformance during rallies.
In 2025, nearby COMEX gold futures rose 64.4%. GDX posted a 152.9% 2025 gain, while GDXJ was up 166.2% last year.
In early June 2026, COMEX gold futures rose 3.5% from the end of 2025. GDX was only 0.05% higher since the end of 2025, while GDXJ was up 0.07% over the same period. While mostly inconclusive, the gold mining ETFs have underperformed COMEX gold futures in 2026, confirming the current consolidation pattern with a bearish bias, as evidenced by lower highs.
The GDX and GDXJ mining ETFs can be excellent barometers of bullish and bearish sentiment in the gold market. While they underperform, the downside risks increase; when they outperform gold futures, the odds favor higher gold prices. The mining shares are currently confirming that gold’s price is stuck in neutral. If crude oil prices begin to fall sharply, monitor GDX and GDXJ for clues on how gold will react.
On the date of publication, Andrew Hecht did not have (either directly or indirectly) positions in any of the securities mentioned in this article. All information and data in this article is solely for informational purposes. For more information please view the Barchart Disclosure Policy here.

/Microsoft%20sign%20at%20the%20headquarters%20by%20VDB%20Photos%20via%20Shutterstock.jpg)