I concluded a March 6, 2026, Barchart article on uranium with the following:
While there are compelling factors supporting higher uranium prices, the optimal approach for investors and traders is purchasing uranium exposure during periodic corrections. Buying URNM on price weakness is likely to be optimal in 2026.
The URNM ETF was trading at $65.98 per share on March 6 and has since declined substantially, falling below $52 per share in June 2026. This could be the perfect time to add this ETF to your portfolio.
Uranium’s price remains strong
Cameco, one of the world’s leading uranium producers, publishes prices monthly.
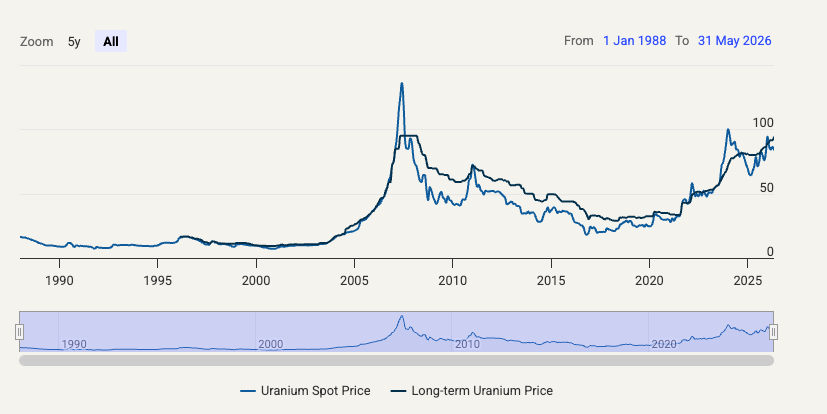
The chart shows that at the end of May, uranium’s long-term price was $94, with the spot price at $84.18, and both remain in a long-term bullish trend since July 2021.
URNM has declined, but remains in a bullish long-term trend
The Sprott Uranium Miners ETF (URNM) has corrected from the January 2026 record high of $84.95 per share and from the March 6 price that was just below $66 per share.
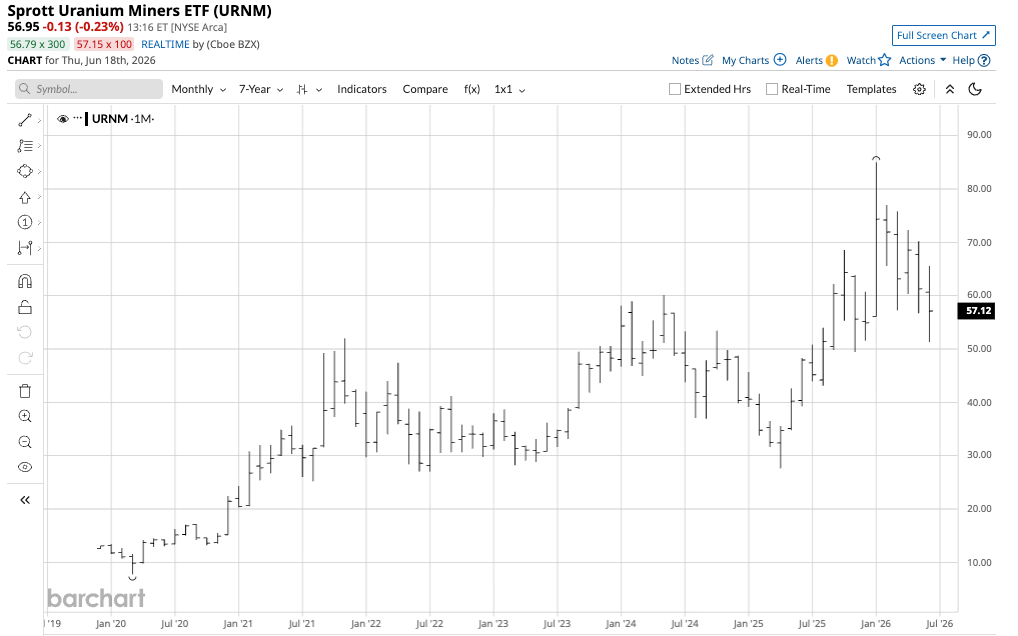
The monthly chart shows that at $56.95 on June 18, URNM was substantially below the prices in late January and on March 6, 2026. However, the long-term bullish trend remains intact with technical support at the April 2025 “Liberation Day” low of $27.60 per share. The optimal strategy could be a scale-down buying approach to accumulate URNM during the current price weakness.
URNM has a diversified uranium-related portfolio and is a liquid ETF
The top holdings of the URNM ETF as of June 10, 2026, include:
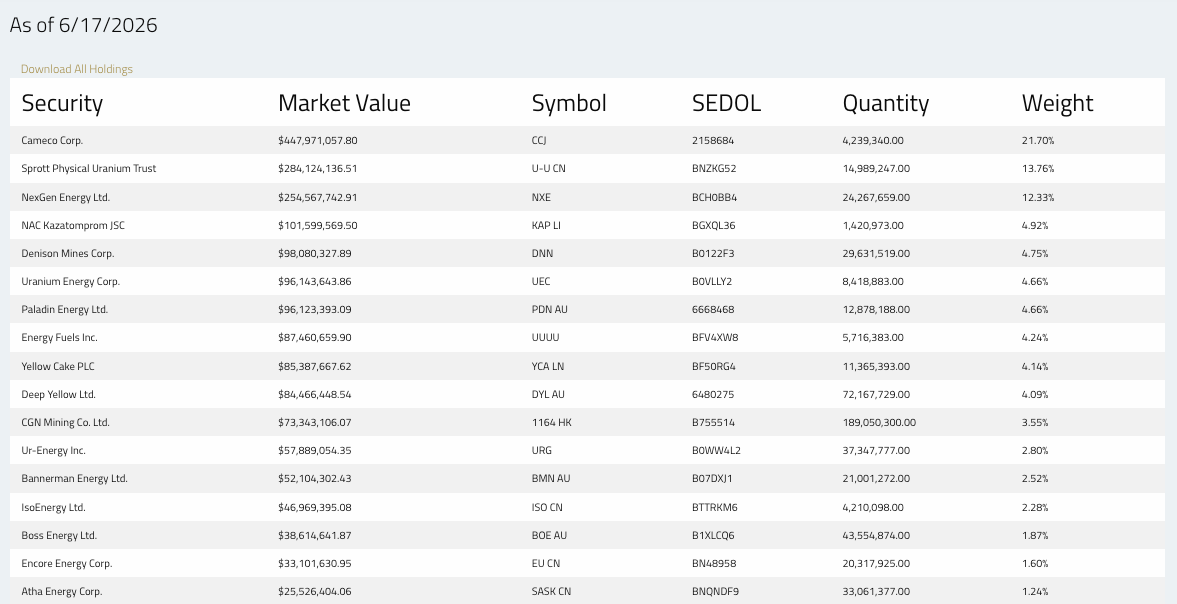
A full list of URNM’s holdings is available through this link. Note that URNM has a 13.76% exposure to the Sprott Physical Uranium Trust, which holds physical uranium.
URNM’s overview states:
URNM is a liquid ETF with over $2.059 billion in assets under management. URNM trades an average of over 790,000 shares per day and charges a 0.75% management fee. The ETF’s 2025 distribution was $1.74 per share, translating to a 3.06% yield at a price of $56.95 per share.
Levels to watch in URNM
URNM is approaching a technical support level.
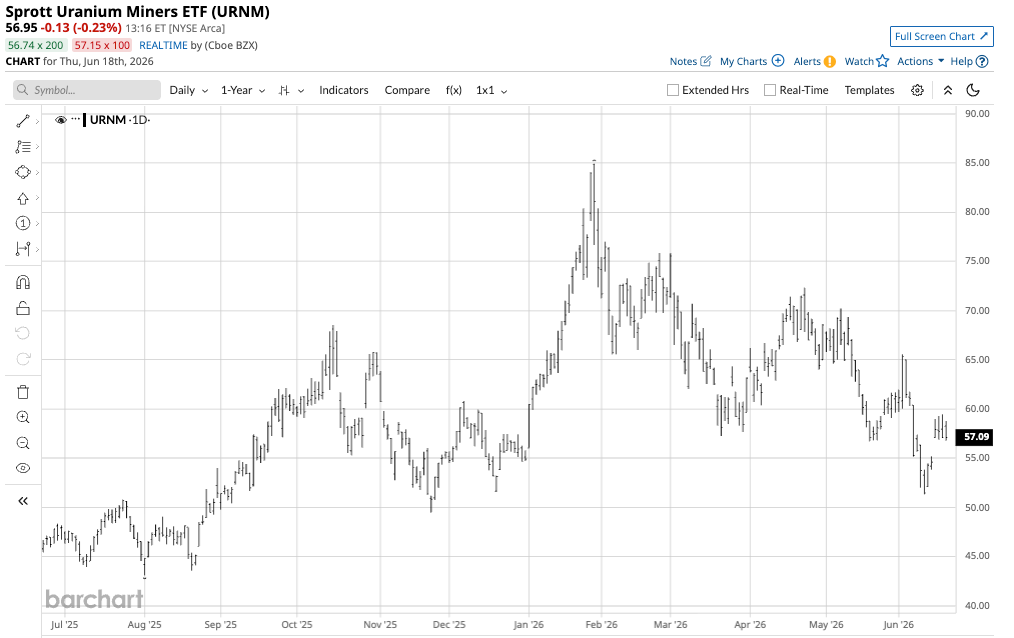
The daily chart shows that the first technical support level is at the November 21, 2025, low of $49.46 per share. Below there, the August 2025 low of $43.10 is the next downside technical target.
On the upside, technical resistance levels are at the June 2, 2026, high of $65.57 per share and the April 23, 2026, high of $72.33 per share. URNM was below the midpoint of support and resistance levels on June 11, 2026.
The case for uranium remains strong
The case for higher uranium prices and the URNM remains compelling. Geopolitical tensions have led to increased military spending and weapons production. Uranium is a critical ingredient in nuclear weapons, nuclear-powered submarines, and high-density material for conventional armor-piercing munitions.
AI-related energy demand is rising, driving demand for nuclear power, an alternative to traditional fossil fuels. Moreover, climate change initiatives are increasing the demand for nuclear power and uranium.
The current risks associated with uranium and the URMN ETF include a risk-off period in markets that could push prices lower. However, I would view any price weakness over the coming weeks and months as a buying opportunity for URNM, given the compelling case for uranium demand and prices over the coming months and years.
On the date of publication, Andrew Hecht did not have (either directly or indirectly) positions in any of the securities mentioned in this article. All information and data in this article is solely for informational purposes. For more information please view the Barchart Disclosure Policy here.
/A%20close-up%20of%20a%20SpaceX%20sign%20by%20Sundry%20Photography%20via%20Adobe%20Stock.jpeg)

/AI%20(artificial%20intelligence)/AI%20chip%20by%203Dsss%20via%20Shutterstock.jpg)

