- RTX (RTX) shares have successfully carved out a robust, multi-week price floor, and now appear to have a higher trajectory.
- The stock currently carries an 8% “Sell” overall technical opinion from Barchart, up from 56% a month ago. The trend is shifting up.
- Near-term momentum indicators have turned sharply constructive, yet lack signs of an overstimulated price surge.
- Having safely defended the $170 level on multiple occasions, the aerospace giant’s chart pattern represents a strong return/risk tradeoff.
Today’s Featured Stock
Valued at $247 billion, RTX Corporation (RTX) is a global giant within the aerospace and defense sector, servicing commercial, military, and government contractor ecosystems. Operating through its three high-margin divisions — Collins Aerospace, Pratt & Whitney, and Raytheon — the massive industrial anchor relies on multibillion-dollar backlogs and secular geopolitical defense demands to drive highly resilient free cash flow expansion.
What I’m Watching
I found today’s Chart of the Day by using Barchart’s powerful screening functions to sort for stocks with notably improving technicals, a combination of momentum, strength, and direction. I then used Barchart’s Flipcharts feature to review the charts for timely opportunities. RTX checks those boxes.
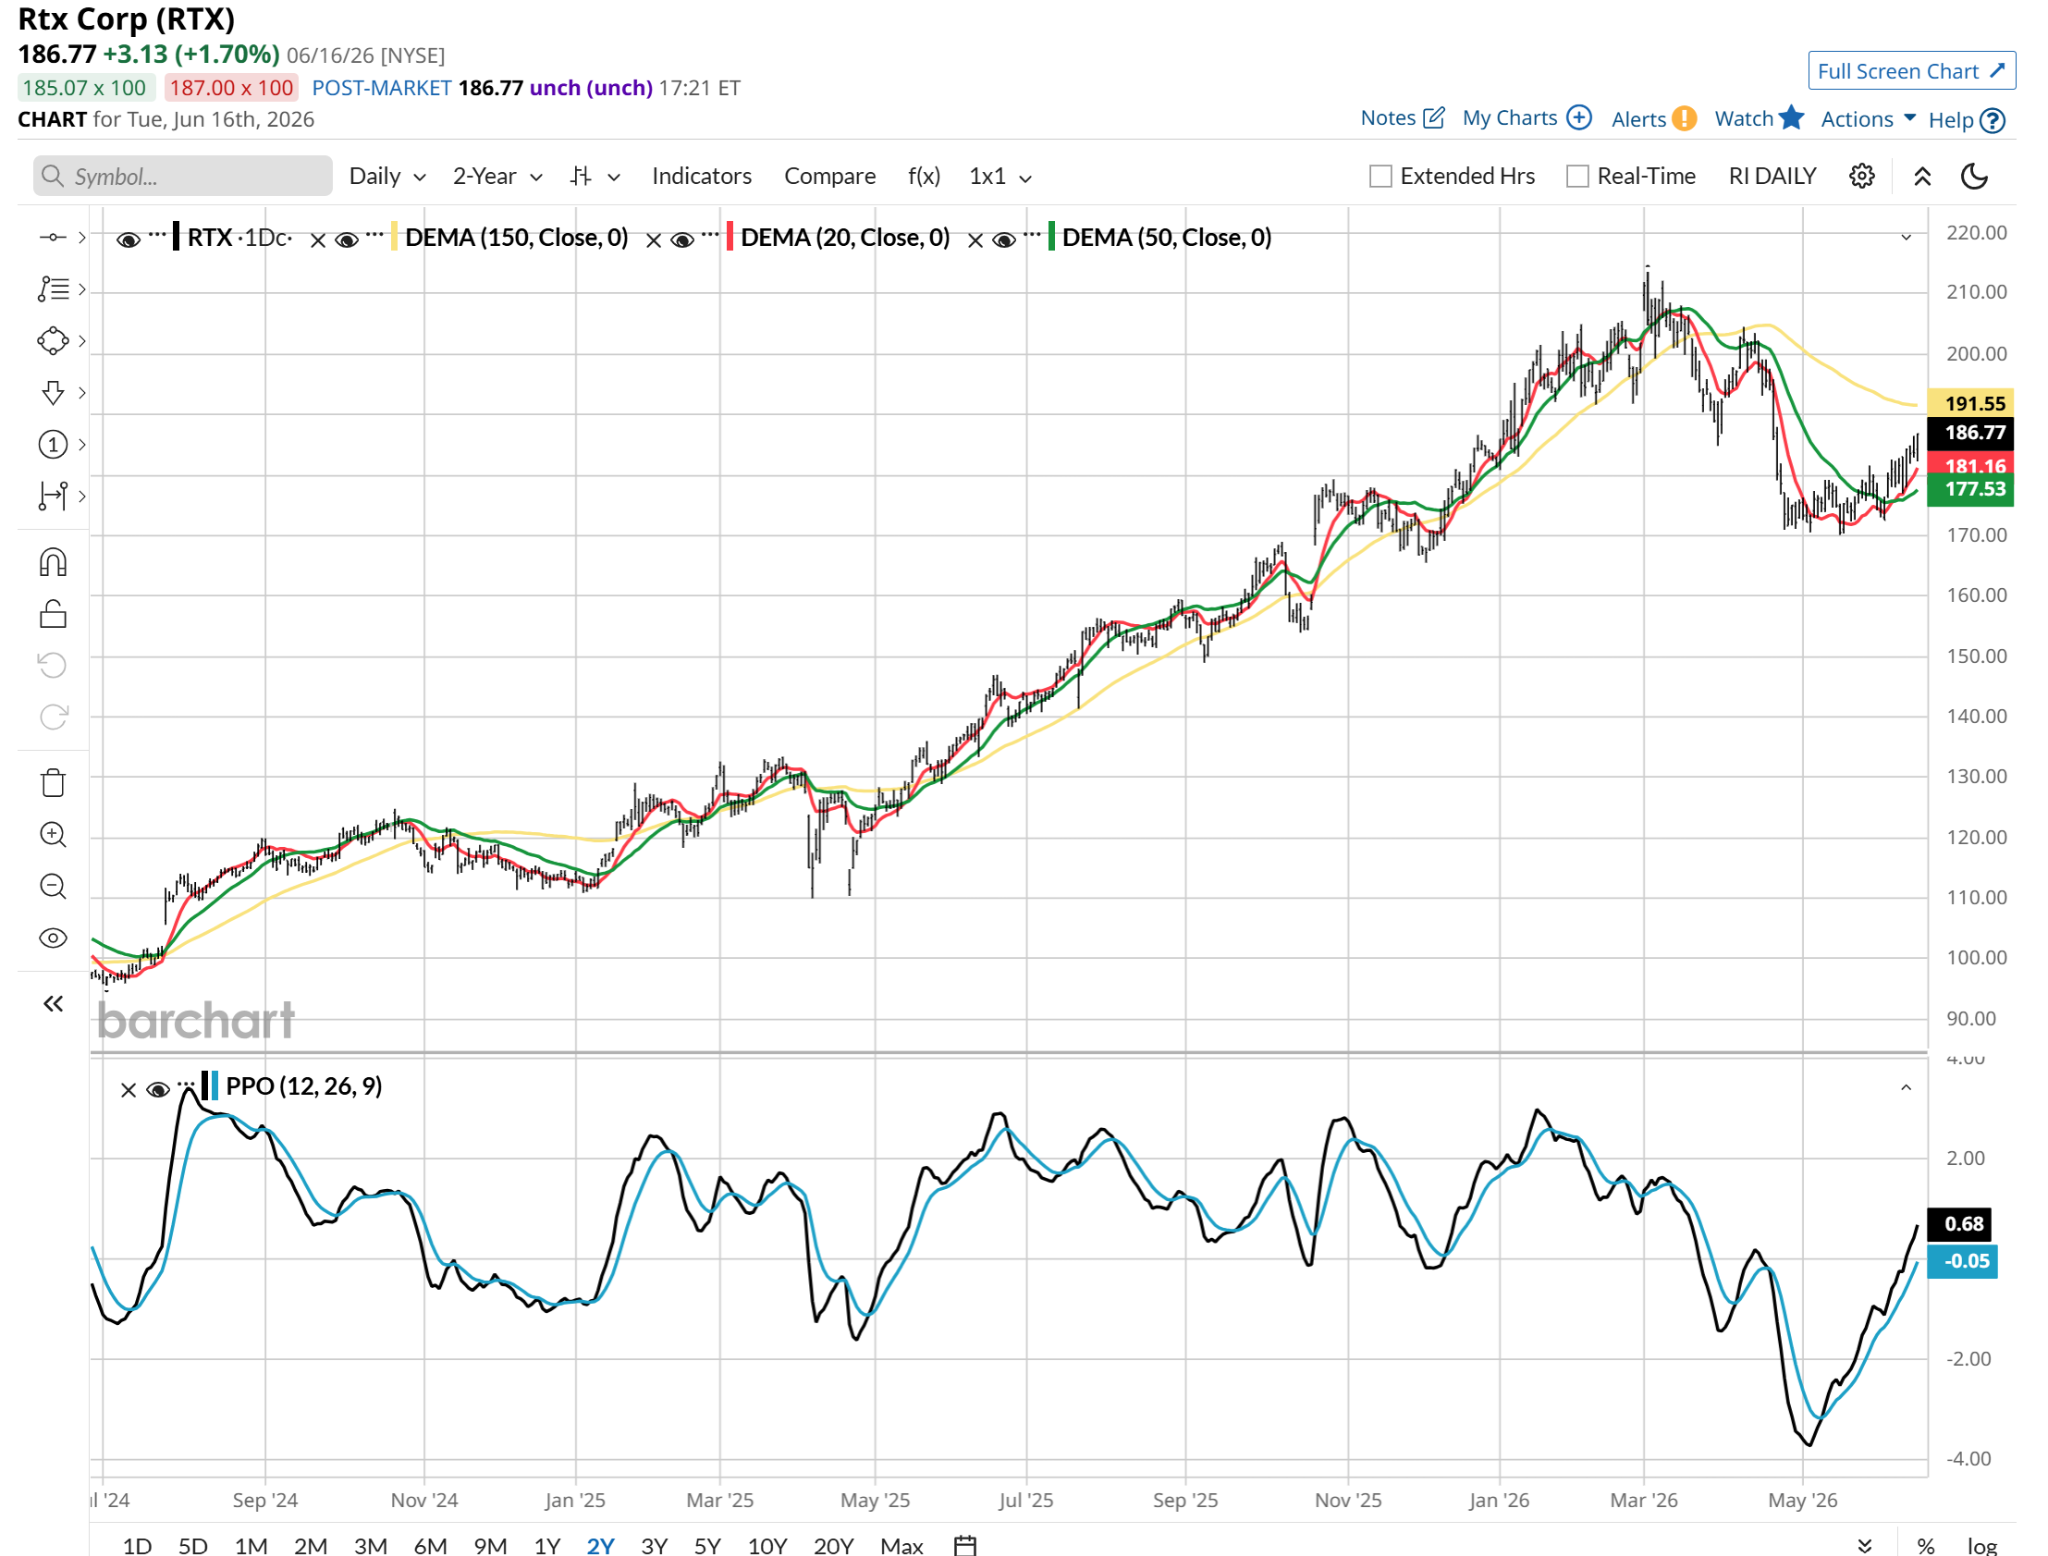
RTX has initiated a textbook technical trend recovery, springing decisively from its rolling multi-month bottom of $170 established in mid-May. Its 20-day exponential moving average has converted into a high-percentage pattern for future upside. The Price Oscillator (PPO) has an exceptional bullish layout as its trajectory forms a sharp upward curve. It appears to confirm that institutional value hunters have aggressively stepped back into the stock.
Barchart Technical Indicators for RTX
Editor’s Note: The technical indicators below are updated live during the session every 20 minutes and can therefore change each day as the market fluctuates. The indicator numbers shown below therefore may not match what you see live on the Barchart.com website when you read this report.
- 8% Sell Barchart Opinion: This was 56% Sell last week, and 56% Sell a month ago. It’s early in the process, but this is headed in the right direction.
- Trend Seeker Status: RTX turned to a “Buy” on this proprietary Barchart measure just last Friday, June 12, at $183.53. This indicator for this stock has produced a strong five-year performance with an average trade length of 42 days across 23 buy trades.
- The next logical upside target is north of $200. And potentially to challenge the stock’s all-time high just above $213.
Don’t Forget the Fundamentals
- $247 billion market capitalization.
- 28x trailing price-earnings ratio.
- 2.60x price/earnings-to-growth (PEG) ratio, presenting a highly realistic framework relative to its long-term defensive pipeline metrics.
- 0.55x debt-equity ratio, reinforcing a bulletproof going-forward balance sheet condition as broad borrowing rates remain elevated.
- 0.31 60-month beta, indicating this is a very low volatility large cap stock.
Analyst and Investor Sentiment on RTX
- Wall Street Analysts: A consensus of 25 analysts surveyed by Barchart rate RTX a “Moderate Buy,” with 15 of those firms preserving an explicit “Strong Buy” recommendation.
- Price Targets: 12-month projections stretch from a low of $160 up to an ambitious high of $242, pushing the average consensus target price to $217.
The Bottom Line on RTX
RTX is executing a highly intentional technical turnaround, indicating that the post-peak distribution pressures from earlier in the quarter have been thoroughly exhausted. Supported by a highly secure dividend yield and consistent quarterly earnings surprises, the chart’s reclamation of short-term averages provides an encouraging setup.
With the asset trading comfortably beneath its consensus analyst price target of $217, protecting the newly established support floor at $170 sets up an asymmetric opportunity for fans of lower-beta stocks.
On the date of publication, Jim Van Meerten did not have (either directly or indirectly) positions in any of the securities mentioned in this article. All information and data in this article is solely for informational purposes. For more information please view the Barchart Disclosure Policy here.
/AI%20(artificial%20intelligence)/Ai%20chip%20by%20Quality%20Stock%20Arts%20via%20Shutterstock.jpg)

/A%20hand%20holding%20a%20phone%20with%20the%20Reddit%20logo_%20Mamun_Sheikh%20via%20Shutterstock_.jpg)
/Seagate%20sign%20on%20the%20building%20atits%20operational%20headquarters%20By%20JHVEPhoto.jpeg)
/Apple%20logo%20on%20store%20front%20by%20frantic00%20via%20iStock.jpg)