
Corn. Wheat, Soybean Analysis With Fibonacci & W.D. Gann
The charts are key to this analysis.
There are two methods we use at ONE44 to find support and resistance in the markets.
The first are major Gann squares, these are the yellow horizontal lines on the chart.
The second is Fibonacci retracements.
On the charts you can see how many times the markets found support, or resistance and the major Gann squares and Fibonacci retracements.
We have done 45 videos on how to use the Fibonacci retracements with the ONE44 rules and guidelines. These Videos are worth watching even if it is not in the market you are trading, as the ONE44 rules and guidelines are the same for every market. You will also see why we believe the Fibonacci retracements are the underlying structure of ALL markets. This is the latest.
This is our analysis for the week using these methods.
July
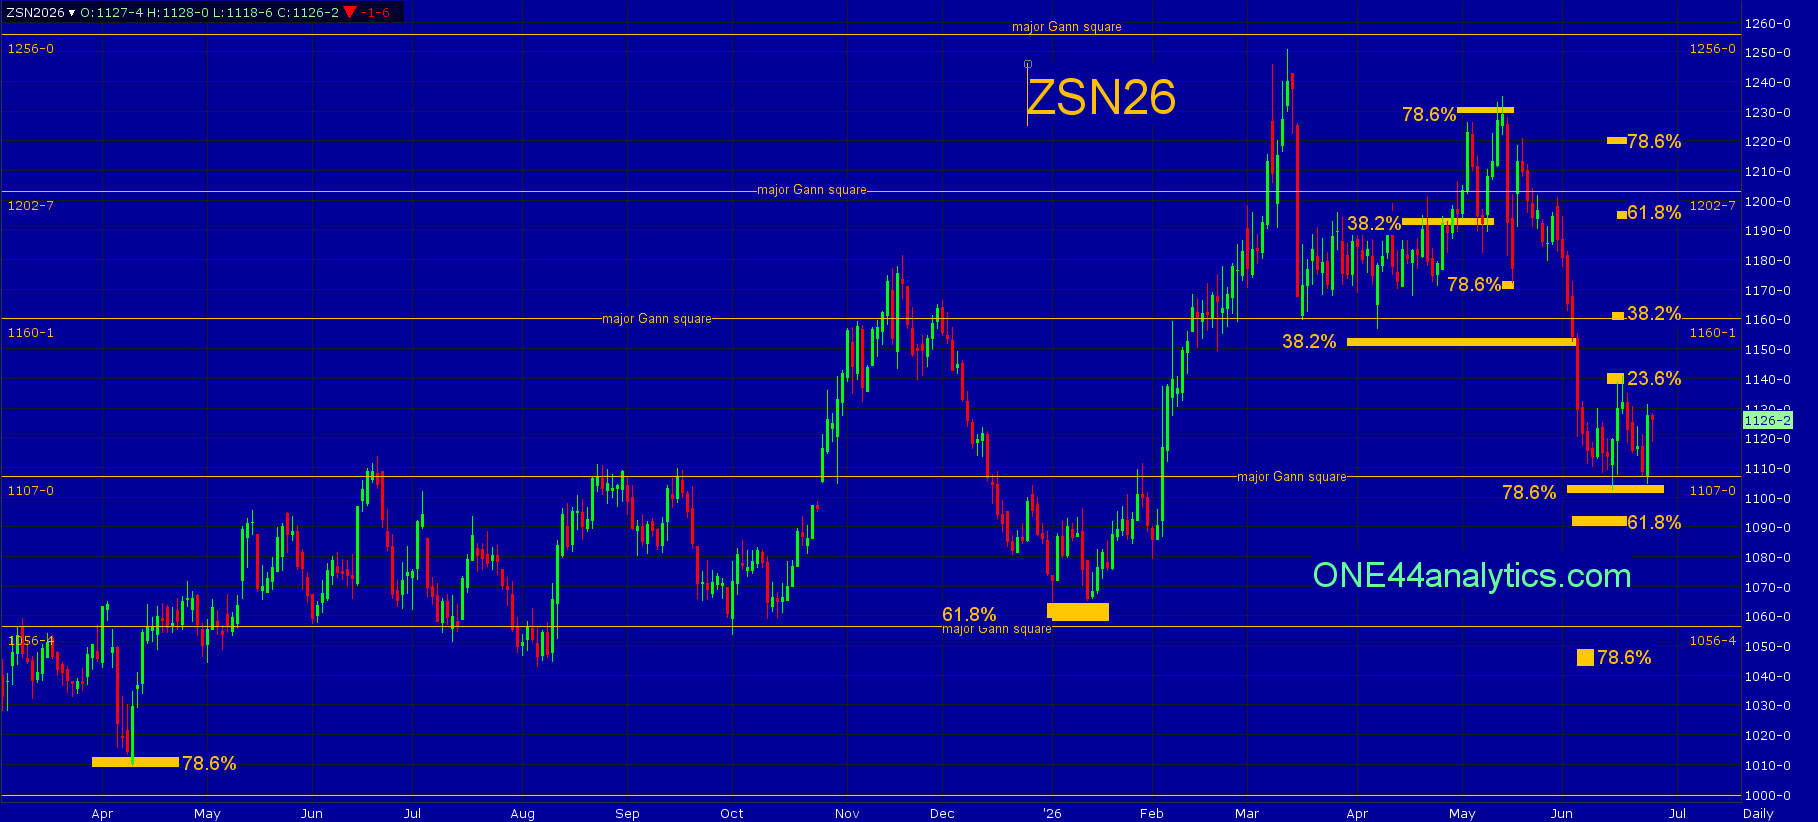
From last week,
July put out a new low this week, but held the 1107.00 major Gann square and swing point for the week. With the new low it hit the 78.6% level at 1104.00 and this reset the retracements above. The high for the week could only get to 23.6% back to the 3/12/26 high at 1139.00 and this is not a good sign, so it will be the key level for the week.
Use 1139.00 as the swing point for the week.
Below it, you still have to watch for a trade below 1107.00 that holds 1094.00 (61.8%) and closes back above 1107.00 as this can cause a sharp rally. The long...
The rally from the 1107.00 major Gann square and 78.6% at 1104.00 could only get up to 23.6% back to the 3/12/26 high at 1139.00. The setback from there hit the 1107.00/1104.00 area today again and the 78.6% level at 1104.00 will be the key level for the week. Provided it can hold 1104.00 (78.6%) the long term target is 78.6% the other way at 1219.00 per the ONE44 78.6% rule.
Use 1104.00 as the swing point for the week.
Above it, the short term target area is the 1160.00 major Gann square and 38.2% back to the 3/12/26 high at 1160.00, it is also a major Gann square and the level that needs to be taken out to turn the short term trend positive. The longer term target area is 61.8% of the same move at 1194.50 and the 1202.75 major Gann square. The long term target is the completion of the 78.6% (1104.00) to 78.6% at 1219.00 (ONE44 78.6% rule).
Below it, you still have to watch for a trade below 1107.00 that holds 1094.00 (61.8%) and closes back above 1107.00 as this can cause a sharp rally. The long term target area is the 1056.50 major Gann square and 78.6% back to the contract low at 1049.00.
Corn
July
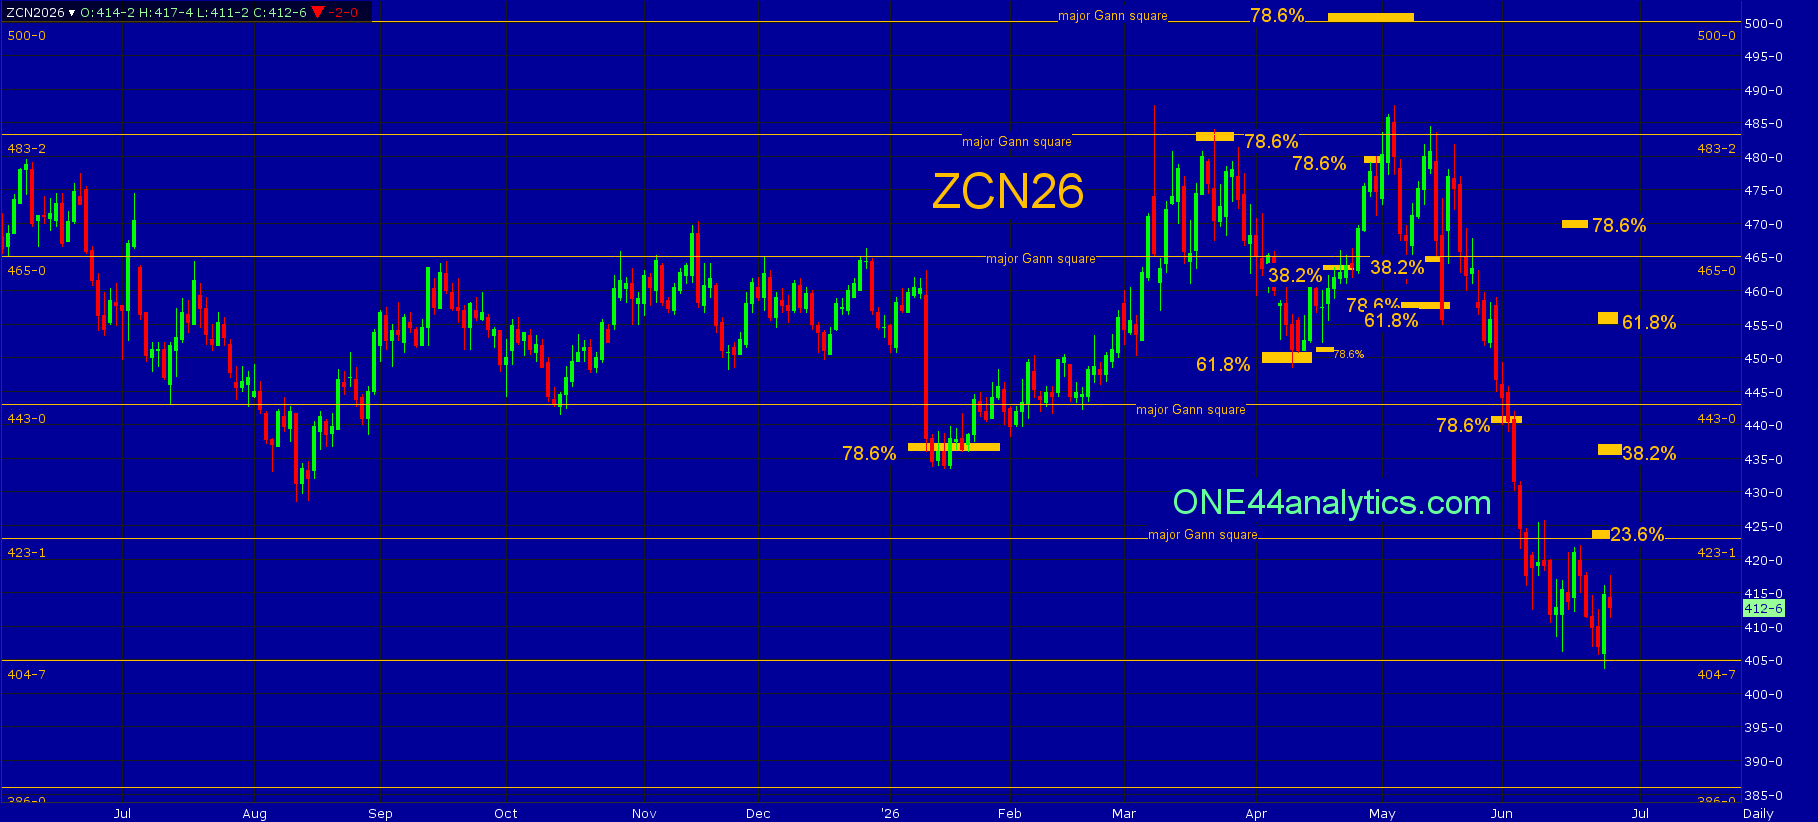
From last week,
The low for the week was just shy of the 404.75 major Gann square and this will be the key level for the week. We will now watch the retracements above to see if this market can turn the short term trend positive.
Use 404.75 as the swing point for the week.
Today it hit the 404.75 major Gann square and swing point for the week and this will again be the key level for the week. It made a new low this week and this will bring the retracements above down.
Use 404.75 as the swing point for the week again.
Above it, the short term target is 23.6% back to the 5/5/26 high at 423.00, this is also a major Gann square. The longer term target is the short term swing point at 436.00, this is 38.2% of the same move and the level that needs to be taken out to turn the short term trend positive. The long term target is 61.8% of the same move at 455.50.
Below it, there are only major Gann squares to look for support and then use as the swing point when closed below, the next two are 386.00 and 365.50.
Wheat
July
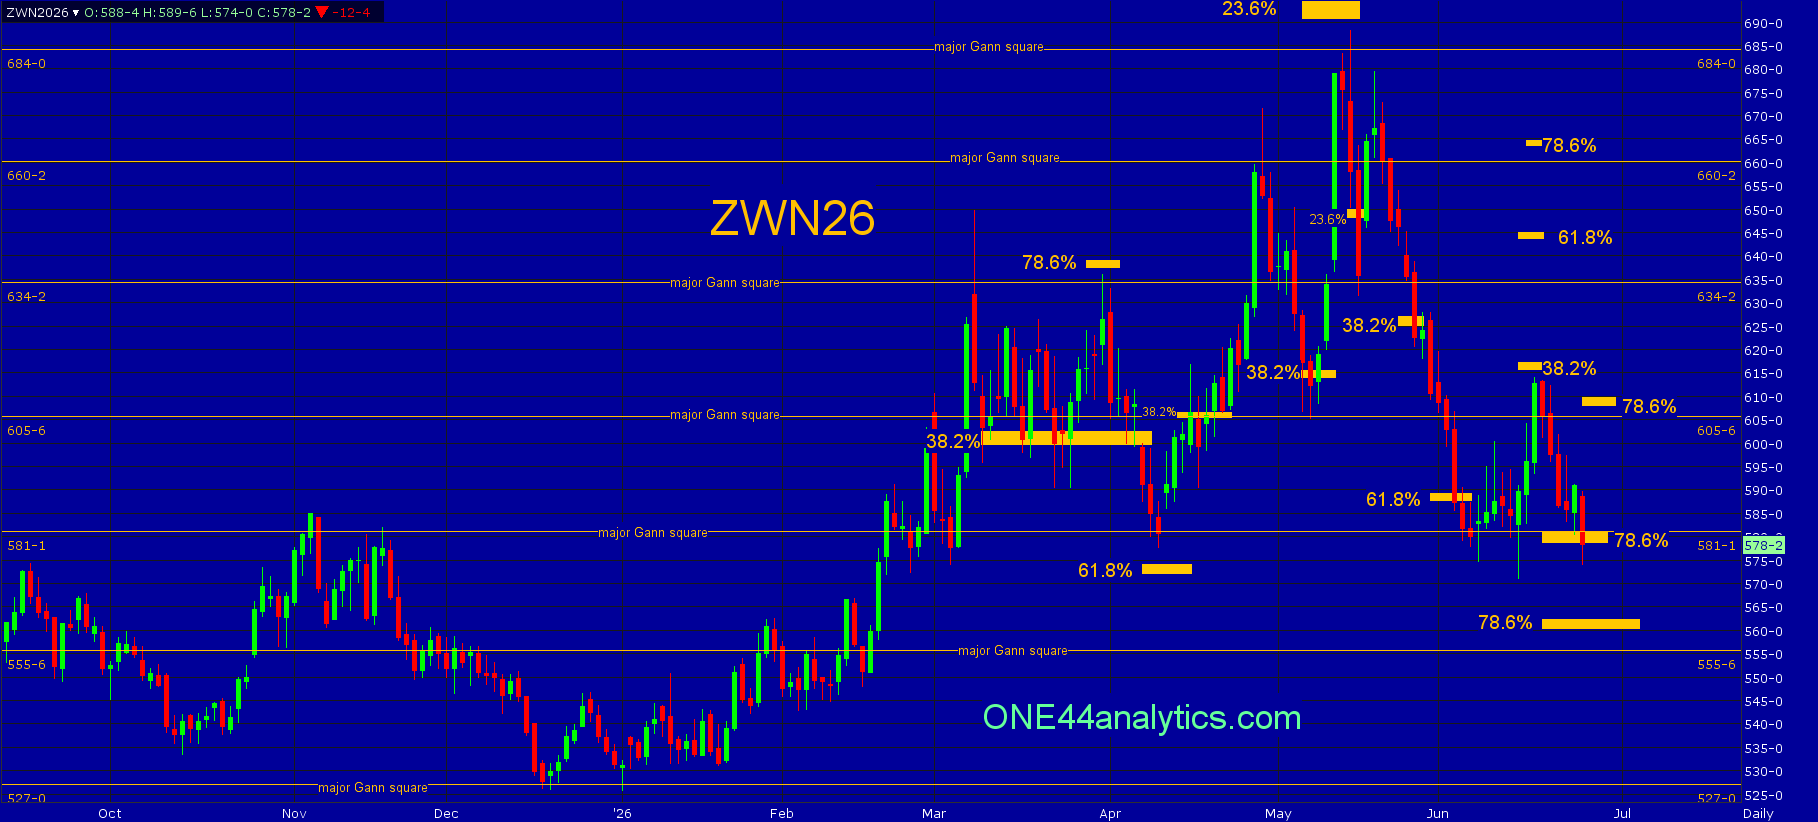
From last week,
Wheat held the 581.00 major Gann square and swing point for the week, it did make a new low and this lowered the retracements above. With the new low 38.2% moved down to 616.00, it hit it today and this will be the key level for the week. This is the level that needs to be taken out to turn the short term trend positive.
Use 616.00 as the swing point for the week.
Below it, the short term target is 78.6% back to the 6/15/26 low at 581.00, this is also a major Gann square. The longer term...
The break from 616.00 (38.2%) hit the short term target of 78.6% at 581.00, this is also a major Gann square and will be the key level for the week. We will now see if this level holds and becomes the start of the next bull move (ONE44 78.6% rule).
Use 581.00 as the swing point for the week.
Above it, the short term target is the first target when using the ONE44 78.6% rule and that is 78.6% of where it just came from at 608.00. Since it already reacted to 38.2% at 616.00 (it still needs to take this out to turn the short term trend positive) the target is 61.8% at 644.00. The long term target area is the 660.25 major Gann square and 78.6% at 663.50.
Below it, the short term target is 78.6% back to the 6/15/26 low at 581.00, this is also a major Gann square. The longer term target area is 78.6% back to the contract low at 561.00 and the 555.75 major Gann square. A failure to turn back up from this area will give us only major Gann squares to look for support and then use as the swing point when closed below, the next two are 527.00 and 500.25.
ONE44 Analytics where the analysis is concise and to the point
Our goal is to not only give you actionable information, but to help you understand why we think this is happening based on pure price analysis with Fibonacci retracements, that we believe are the underlying structure of all markets and Gann squares.
If you like this type of analysis and trade the Grain/Livestock futures you can become a Premium Member.
You can also follow us on YouTube for more examples of how to use the Fibonacci retracements with the ONE44 rules and guidelines.
Sign up for our Free newsletter here.
FULL RISK DISCLOSURE: Futures trading contains substantial risk and is not for every investor. An investor could potentially lose all or more than the initial investment. Commission Rule 4.41(b)(1)(I) hypothetical or simulated performance results have certain inherent limitations. Unlike an actual performance record, simulated results do not represent actual trading. Also, since the trades have not actually been executed, the results may have under- or over-compensated for the impact, if any, of certain market factors, such as lack of liquidity. Simulated trading programs in general are also subject to the fact that they are designed with the benefit of hindsight. No representation is being made that any account will or is likely to achieve profits or losses similar to those shown. Past performance is not necessarily indicative of future results.

/Renewable%20Energy%20by%20Yuri%20Hoya%20via%20Shutterstock.jpg)


/Micron%20Technology%20Inc_%20logo%20on%20building-by%20vzphotos%20vis%20iStock.jpg)