/Micron%20Technology%20Inc_%20logo%20on%20building-by%20vzphotos%20vis%20iStock.jpg)
Micron Technology (MU) surprised with 16% higher revenue in FY Q3 (ending May 28) than analysts' forecasts. Moreover, they have significantly raised their FY 27 forecasts. As a result, MU stock's fair market value (FMV) could be as much as $2,500 per share, or almost double its closing price on Thursday, based on strong FCF expectations next year.
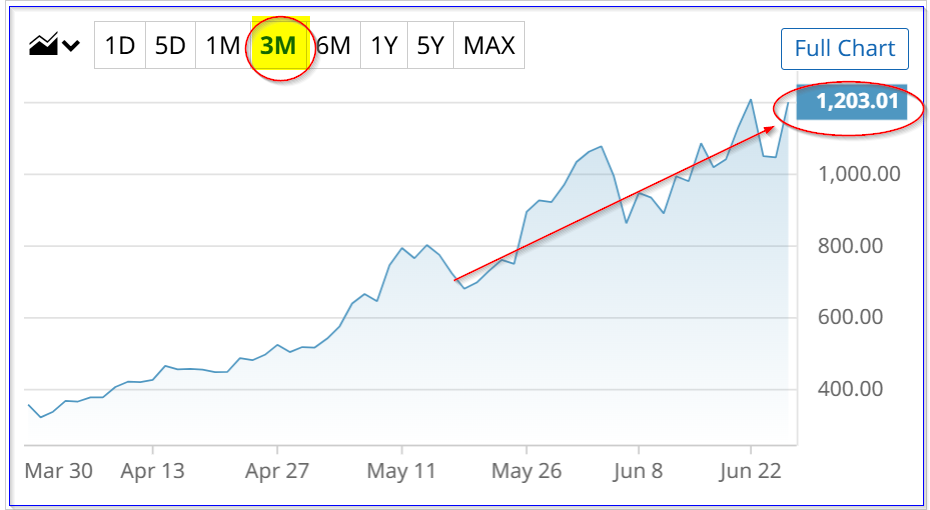
As a result, MU skyrocketed over 15.7% on Thursday, June 25, to $1,213.56. This is based on the company's strong performance and the market's realization that memory prices are likely to stay high next year and beyond.
Strong Revenue and Higher Implied Free Cash Flow (FCF)
Micron's Q3 memory $41.456 billion in revenue rose 357% compared to last year and was up 73.75% compared to last quarter ($23.86 billion). That is astounding, and was even $5.64 billion, or +15.75% over analysts' forecasts, according to Seeking Alpha.
As a result, analysts have dramatically raised their revenue forecasts. In a prior article in Barchart, I wrote that analysts had previously forecast $183.62 billion in revenue for the year ending Aug. 2027 (FY 2027). Now, given management's forecast of $50 billion for Q4, analysts have raised their FY 27 forecasts to $225.71 billion, according to Seeking Alpha.
Moreover, this implies that Micron's free cash flow (FCF) performance will be higher than expected. For example, in FY Q3, the company generated $18.3 billion in adjusted FCF (the company's calculation) on $41.456 billion in revenue.
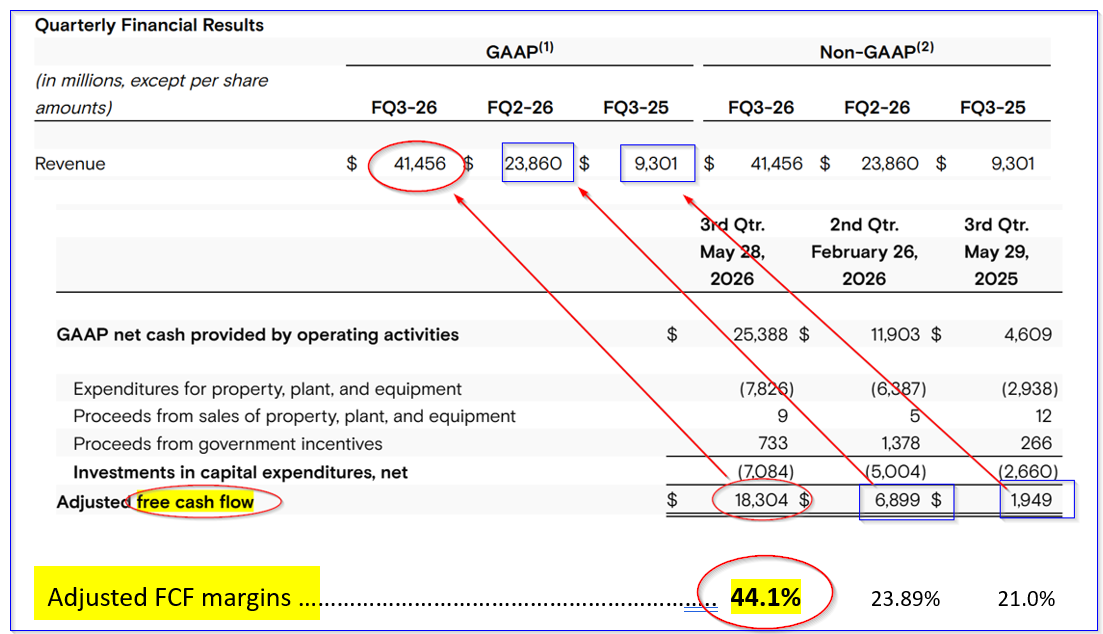
That represents a huge increase in FCF and the relevant FCF margin:
FCF margin of 44.1%, vs. last quarter's 28.9% margin (i.e., $6.9b FCF/ $23.86b revenue)
In other words, as revenue has surged, the company's ability to squeeze out more profits and cash flow has also accelerated. That is a true sign of high operating leverage. It also implies that with higher revenue, we can forecast even higher adjusted FCF margins.
For example, using analysts' new FY 27 revenue forecasts, and assuming at least a 50% FCF margin, we can project adjusted FCF will be over $112 billion:
$225.71b FY 27 revenue x 0.50 = $112.86 billion adj. FCF FY 2027
That is 54% higher than the run rate adj. FCF taken from Q3:
$18.3b x 4 = $73.2b run rate adj. FCF
$113b FY 27 est. / $73.2 run rate = 1.54
In other words, Micron's fair market value is likely to be at least 54% higher. Let's look at this.
Micron's FMV and Price Targets (PT)
Analysts are playing catch-up with MU stock. We can't rely on them to get this right. Let's use our own estimates.
For example, Micron's market cap today, even after its huge spike, is over $1.39 trillion:
1,128 million shares outstanding Q3 x $1,213.56 = $1,369 billion market value (see Yahoo! Finance's calculation)
So, using the run rate adj. FCF estimate, its FCF yield is 5.34%:
$73.2b adj. FCF / $1,369 b = 0.0534
I wrote a Barchart article on June 5 in which I showed that the market will eventually value Micron with a much lower FCF yield. I suspect that after yesterday's report, it will eventually fall to 3%, which is typical for AI-related technology stocks.
Setting an Upper Range Price Target. Therefore, let's use a 4.0% FCF yield to set Micron's fair market value (i.e., below its existing 5.34% run rate adj. FCF yield):
$113b FY adj. FCF / 0.04 = $2,825 billion
That is 106% higher than today's market capitalization of $1.369 trillion. As a result, its price target (PT) is 106% higher than today's price:
$1213.56 price today x 2.06 = $2,500 price target
Setting a Lower Price Target. Moreover, just to be conservative, let's set a lower range by using 45% adj. FCF margin, instead of a 50% margin. That sets the projected adj. FCF at $101.6 billion, so the FMV would be:
$101.6b/ 0.04 = $2.54 trillion FMV
That is 85.5% higher than today's market cap (i.e., $2.54 tr/$1.369 tr), and sets the price target at:
$1,213.56 price today x 1.855 = $2,251 per share PT
The bottom line is that Micron could easily be worth between $2,251 and $2500 per share over the next few years, up between 85% and 106%, or $2,375 per share, almost double (+96%).
On the date of publication, Mark R. Hake, CFA did not have (either directly or indirectly) positions in any of the securities mentioned in this article. All information and data in this article is solely for informational purposes. For more information please view the Barchart Disclosure Policy here.

/A%20close-up%20of%20a%20General%20Motors%20corporate%20sign%20by%20lindaparton%20via%20Adobe%20Stock.jpeg)
/Delta%20Air%20Lines%2C%20Inc_%20passanger%20plane-by%20viper-zero%20via%20iStock.jpg)
