
Investors naturally want simplicity. But in a world of rising inflation, geopolitical turmoil, and a stock market fueled by pandemic-era liquidity, asset allocation and time allocation are more closely linked than ever.
Unlike our parents, who relied on defined pensions and stable social security, today’s investors face structural headwinds. Furthermore, economic pressures on our children have created financial interdependencies. Nearly 40% of workers have taken loans or withdrawals from retirement accounts. This means time horizons for many are actively shortening.
Assuming the stock market will indefinitely deliver strong returns is a massive risk. Yet, multiple retirement providers note that Baby Boomers have 70% to 80% of their portfolios allocated to stocks. This widespread complacency motivates me to introduce alternative paths, poking holes in popular investment approaches and urging considerations of wider market scenarios.
A Trifecta Of Redundancy
A recent star of “set-it-and-forget-it” investing is the “Trifecta ETF Portfolio.” Promoted by financial influencers, the pitch relies on picking three specific ETFs for distinct roles: broad growth, dividend cash flow, and technology upside. A classic example includes:
- VTI (Vanguard Total Stock Market (VTI)) – The Core
- SCHD (Schwab US Dividend Equity (SCHD)) – The Income Wingman
- QQQ (Invesco Nasdaq 100 (QQQ)) – The Growth Wingman
On paper, it looks perfectly balanced. In reality, it is just VTI with two wingmen that add no unique value. They either move in sync with VTI, or form a duo that replicates it.
Peeling Back the Labels: The Overlap Problem
When you bundle VTI, SCHD, and QQQ, you assume you are buying three different baskets of stocks. Instead, you are buying the same basket with different marketing stickers.
- QQQ is structurally trapped inside VTI: A staggering 90% of the stocks held in QQQ sit inside VTI. Buying QQQ alongside VTI doesn’t diversify your tech exposure. Instead, it doubles down on the same mega-cap tech giants like Apple, Nvidia, and Microsoft. This happens because a small set of giant stocks dominates any index weighted by market capitalization.
- SCHD is structurally trapped inside VTI: Nearly 98% of the stocks held in SCHD already reside in VTI. Your “income protector” is just a carved-out slice of your core holdings.
Where’s The Beef?
It is the investing equivalent of eating a diet of hamburgers, cheeseburgers, and sliders, and convincing yourself you are getting a well-rounded meal because the items have three different names on the menu. It’s all just beef and buns.
The Illusion of Variety
To prove how much these funds move in tandem, we can look at how they correlate to the broader stock market (using SPY as our benchmark). All data in the table below is sourced from YCharts.
| ETF Name | Ticker | Marketing Role | Real-World Asset Allocation | R-Squared (vs. SPY) | Beta (vs. SPY) |
| Vanguard Total Stock Market | VTI | The Core | 100% All US Stocks | 99% | 1.00 |
| Invesco Nasdaq 100 | QQQ | Growth Wingman | 100% Large Cap Tech/Growth | 85% | 1.18 |
| Schwab US Dividend Equity | SCHD | Income Wingman | 100% Large Cap Value/Dividends | 81% | 0.78 |
The R-Squared column measures how much of an ETF’s movements are explained by the S&P 500 Index ($SPX). A score of 100% means absolute lockstep.
Your “Growth Wingman” (QQQ) has an 85% mathematical relationship to the market, and your “Income Wingman” (SCHD) sits at 81%. Because these numbers are so tightly grouped, they provide zero structural protection during a market shock. When the main ship goes down, the wingmen crash into the ground at the exact same time.
What’s the Alternative?
There are too many to list of course. iShares offers a suite of “risk tolerance” strategies, each in a single ETF. I’ll mention them here, though I’m no fan, since both stocks and bonds are influenced by different factors that they were when a basic stock/bond allocation worked. Years ago.
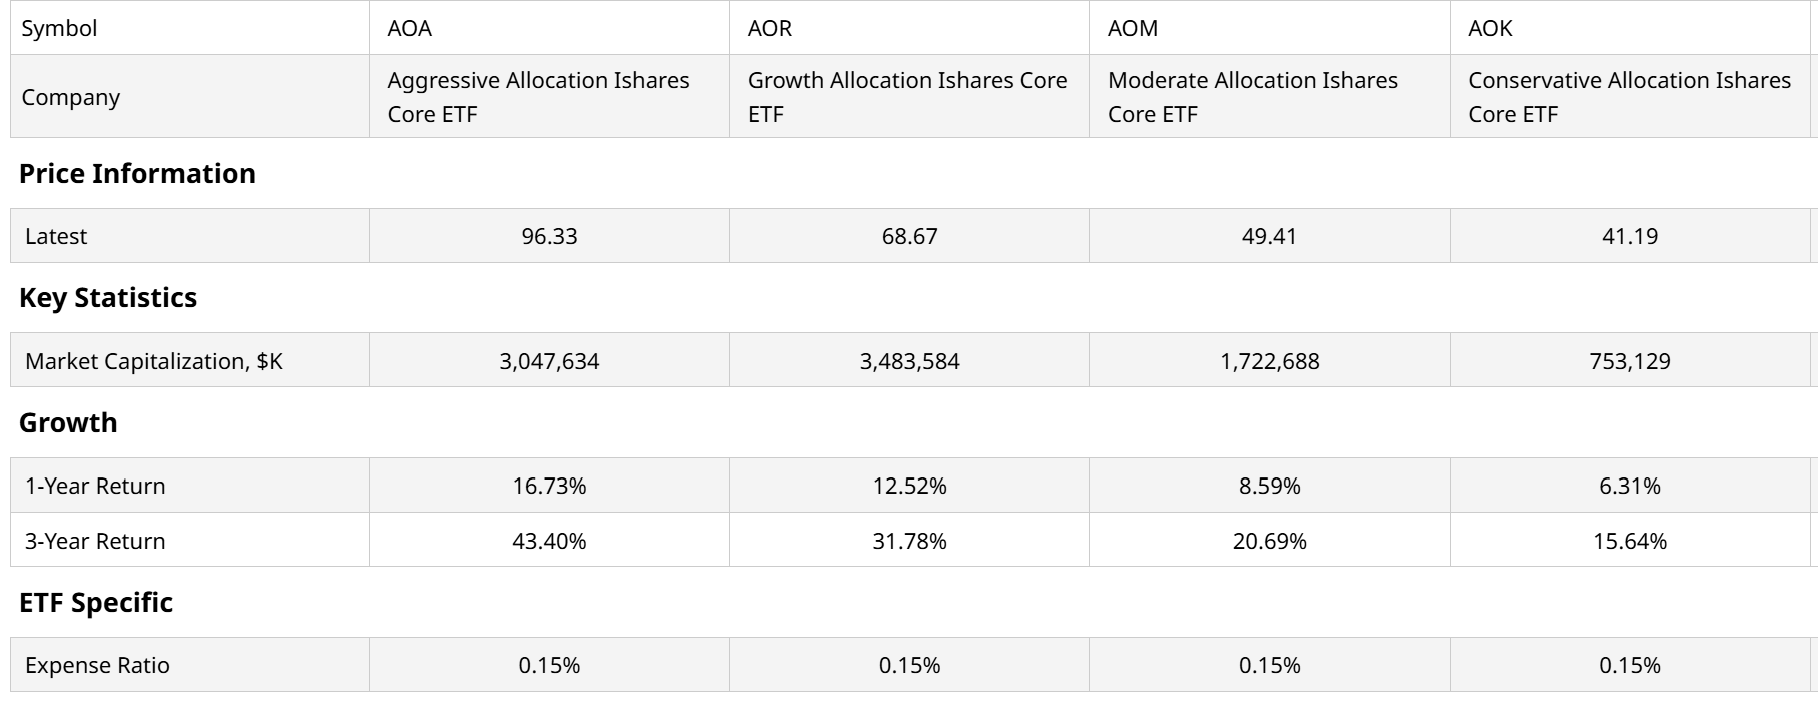
The tickers are AOK (AOK) (conservative risk), AOM (AOM) (moderate risk), AOR (AOR) (growth a.k.a. 60/40 stocks/bonds) and AOA (AOA) (aggressive risk). Check those out, with the understanding that I use them as benchmarks to beat, using more tactical strategies.
Here are a few ETFs that take an alternative approach to trying to manage risk at different levels of risk tolerance.
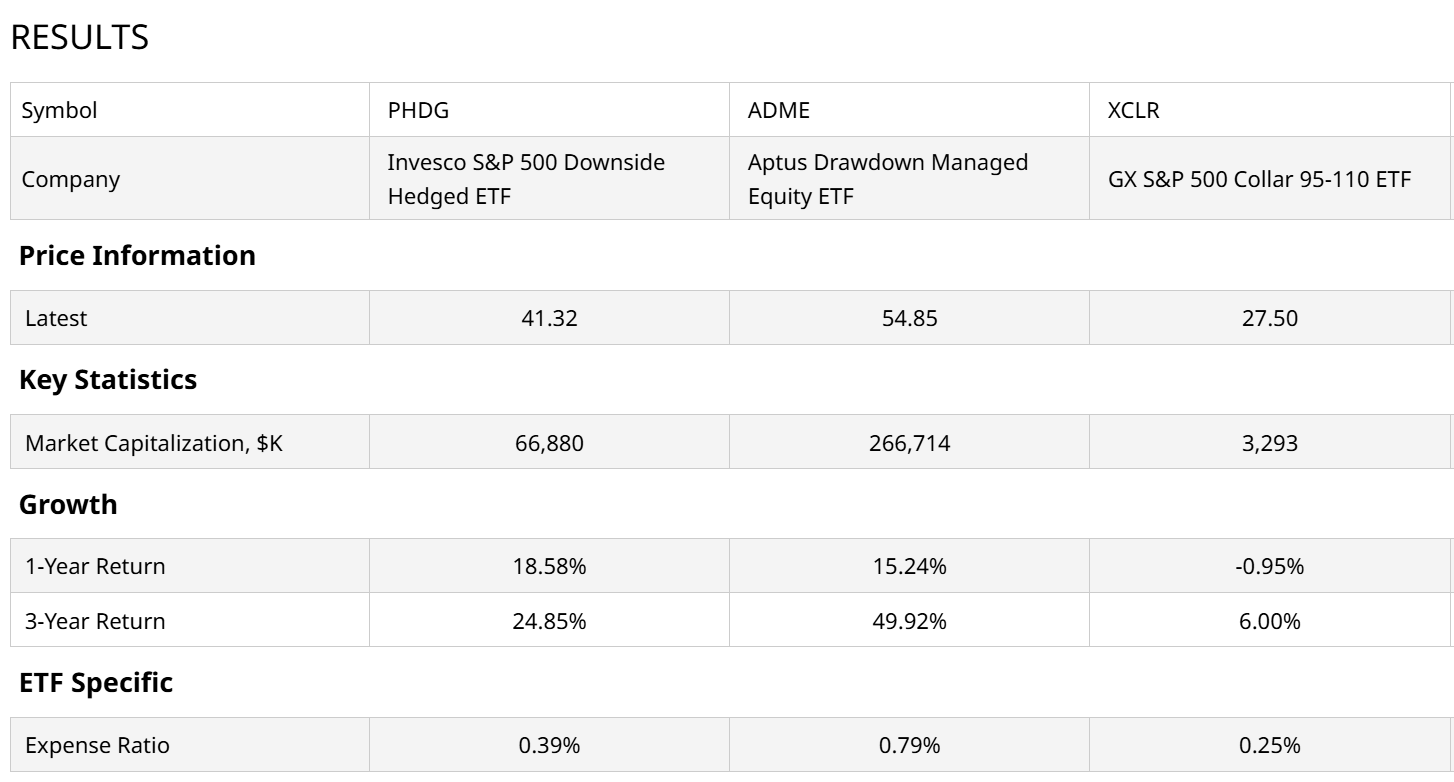
Invesco S&P 500 Downside Hedged ETF (PHDG)
This toolkit abandons traditional bonds and protects your downside by buying structural market insurance. PHDG tracks an index that dynamically allocates your cash across three buckets: S&P 500 stocks, cash, and VIX short-term futures contracts.
The CBOE Volatility Index ($VIX), the market’s “fear gauge,” historically spikes straight up when the stock market collapses. PHDG uses a rules-based system to automatically layer in more VIX futures as market volatility rises. When the market is climbing smoothly, the VIX hedge drags on returns, but when the market falls off a cliff, that built-in fear-index hedge is designed to soften the blow, all without owning a single bond.
Aptus Drawdown Managed Equity ETF (ADME)
This is a hybrid model that focuses heavily on avoiding catastrophic losses. ADME keeps a core footprint in large-cap U.S. stocks to capture upside, but it actively overlays options (specifically yield-generating options and protective put options) to buffer the portfolio.
The goal here isn’t to time the market perfectly or guess the next trend. It’s designed to mathematically minimize the duration and depth of a market drawdown, giving nervous investors an equity-based alternative that actively guards the exit doors.
Global X S&P 500 Collar 95-110 ETF (XCLR)
This toolkit doesn’t use bonds, and it doesn’t try to time the market trend. Instead, XCLR uses a purely mechanical options collar strategy to wrap a safety net around your large-cap stocks.
The fund owns the stocks in the S&P 500, but every three months, it executes a strict formula: it buys put options that are 5% out-of-the-money (capping your maximum drawdown at roughly -5% over that period) and balances out the cost by selling call options that are 10% out-of-the-money. This gives you a clear, range-bound performance profile. You get to participate in broad S&P 500 growth up to a 10% ceiling, but your floor is mathematically locked in against a sudden collapse.
The Takeaway: Know What’s in Your Food
Some investors have a 30-year time horizon and the investing equivalent of “good genes” — they can coast on standard “junk food” passive funds and swallow a massive market correction without blinking. But for everyone else, peeling back the label of your portfolio (or ETF) is an act of preventative medicine.
Don’t buy into the marketing hype of multi-asset “trifectas” that leave you carrying way more risk than you bargained for. If you want a portfolio that actually protects you, get rid of the redundant wingmen. Keep your offense pure, make your defense real, and keep your investment strategy simple enough that you always know exactly what you are consuming.
Rob Isbitts created the ROAR Score, based on his 40+ years of technical analysis experience. ROAR helps DIY investors manage risk and create their own portfolios. For Rob’s written research, check out ETFYourself.com.
On the date of publication, Rob Isbitts did not have (either directly or indirectly) positions in any of the securities mentioned in this article. All information and data in this article is solely for informational purposes. For more information please view the Barchart Disclosure Policy here.

/Space/Planet%20earth%20with%20flying%20rocket%20by%20Sergey%20Mironov%20via%20Shutterstock.jpg)
/AI%20(artificial%20intelligence)/Image%20of%20server%20racks%20in%20modern%20server%20room%20data%20center%20by%20Sashkin%20via%20Shutterstock.jpg)
/Alphabet%20(Google)%20Image%20by%20Markus%20Mainka%20via%20Shutterstock.jpg)
/Jen-Hsun%20Huan%20NVIDIA's%20Founder%2C%20President%20and%20CEO%20by%20jamesonwu1972%20via%20Shutterstock.jpg)