
- The long-term trend of the Barchart National Corn Price Index, the market's intrinsic value, remains down.
- The market's reads on real fundamentals, as opposed to USDA's imaginary version, show commercial traders have been putting pressure on the market as well.
- The NCPI is in a contra-seasonal selloff, an indication that real market fundamentals are different than what we usually see this time of year.
Though I don’t watch them, my guess is the weekend ag-based talk shows were filled with “experts” talking about how bullish the corn market is. I know most of these folks, and the common practice is to continue to say what the industry wants to hear rather than what it needs to hear. As for the latter, the industry doesn’t need to listen to the yammering talking heads, but rather the market. I’ve said this for years, and in fact it is part of Rule #5: It’s the what, not the why. Most like to make up reasons why to fit their personal view of market moves. The reality is we don’t know why, but we can see the what. In corn, the what is the market is still not bullish.
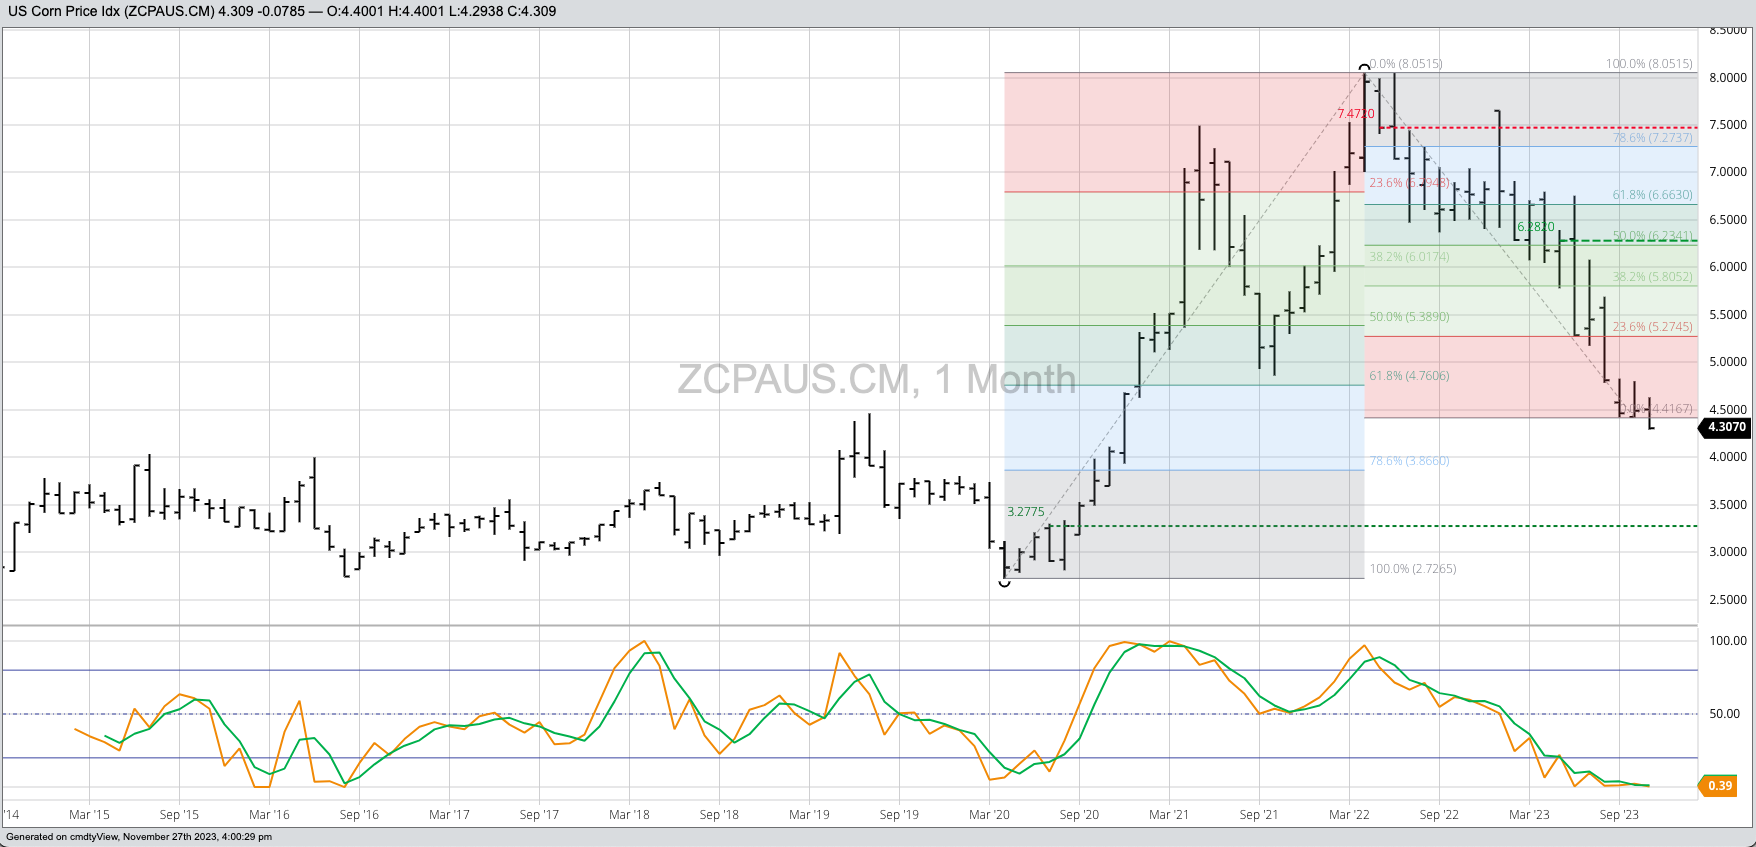
As always, analysis of a market starts with its trend, or price direction over time. In the case of corn, as well as the other grains and oilseeds, the best way to read trend is with the Barchart National Price Indexes, the intrinsic value of the individual markets. For a long-term view, I track the trends on monthly charts, and the Barchart National Corn Price Index (ZCPAUS.CM) has posted a new 2-year low of $4.2938 during November. What this means is the NCPI has extended the long-term downtrend it has been in since May 2022 when it finished the month at $7.4720, a decrease of 42%. There are two ways to look at a new low: 1) Bullish markets don’t make new long-term lows, and 2) Every market hits a new low before rallying. Newsom’s Market Rule #1 says: Don’t get crossways with the trend, and right now the long-term trend remains down.
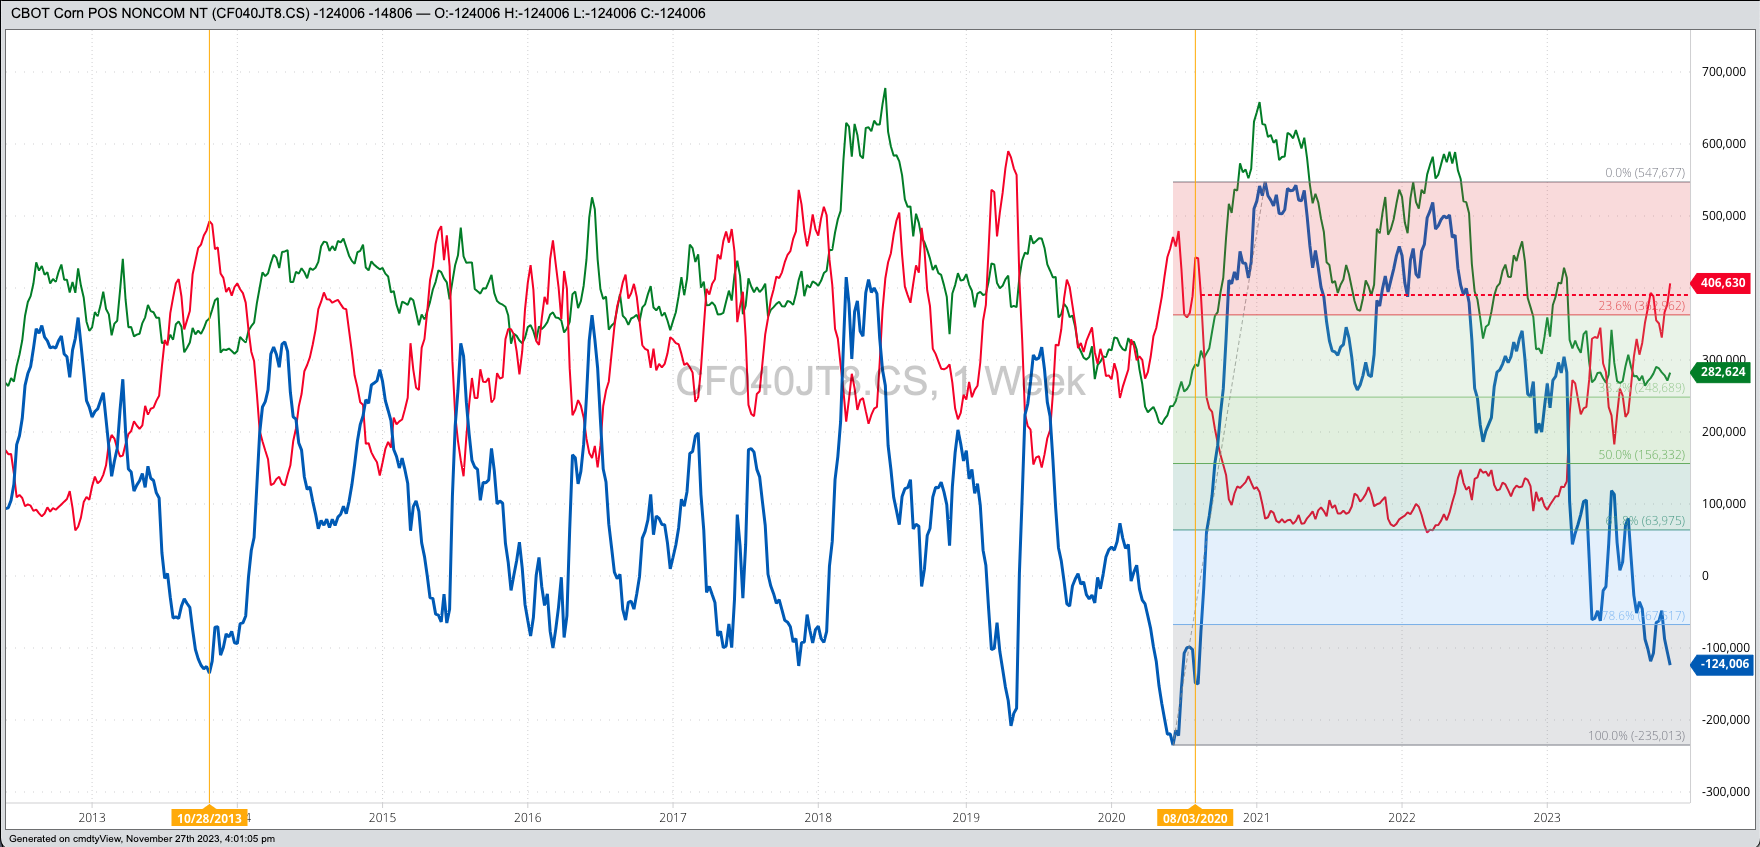
What is pushing the corn market lower? Every market has two sides: Noncommercial and commercial. Newton’s First Law of Motion applied to markets tell us: A trending market will stay in that trend until acted upon by an outside force, with that outside force usually noncommercial activity. The latest CFTC Commitments of Traders report (legacy, futures only) showed noncommercial traders increased their net-short futures position to 124,000 contracts, the largest net-short futures position since the week of August 11, 2020. While this does open the door to a round of noncommercial short-covering at some point, the commercial side of the market isn’t giving funds much reason to get out of short positions.
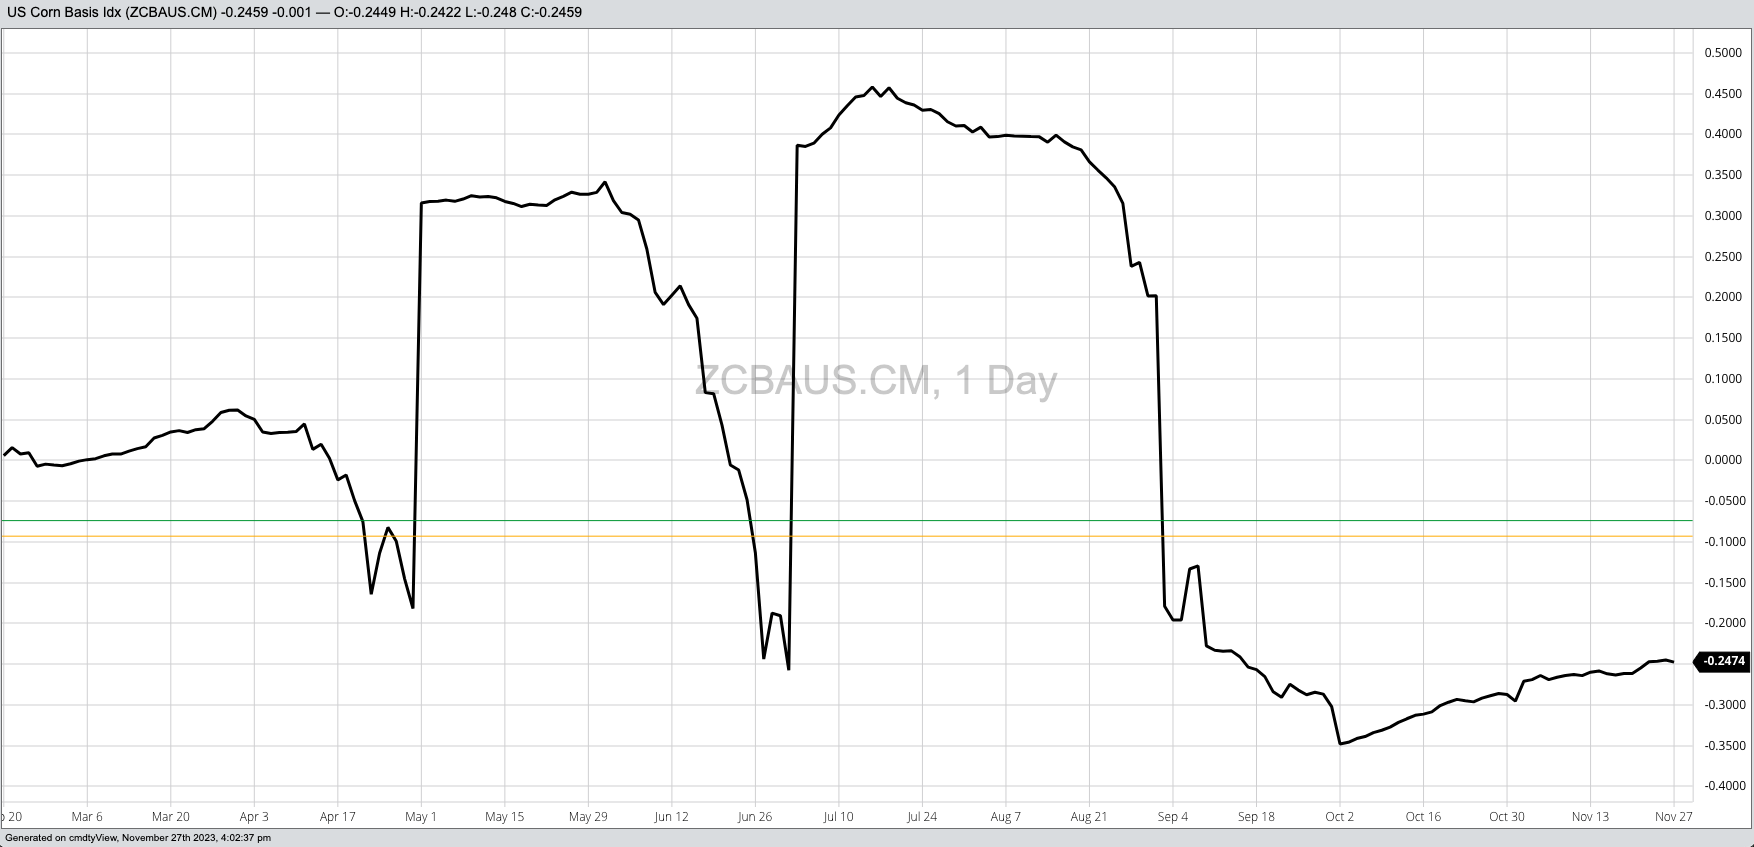
How do we read the commercial view of supply and demand, also known as real market fundamentals? By tracking basis (the difference between cash and futures) and futures spreads. The Barchart National Corn Basis Index (ZCBAUS.CM) came in at roughly 24.5 cents under December futures last Friday, stronger than the previous Friday’s 26.0 cents under December futures. The NCBI continues to run near the 5-year average weekly close. If we calculate basis using the NCPI and March futures last Friday’s figure was 43.75 cents under as compared to the previous week’s 44.5 cents under. With the December issue moving into delivery later this week, basis versus March continues to run below the previous 5-year low weekly close for the first week of December (this coming Friday) at 39.25 cents under. That would be considered bearish.
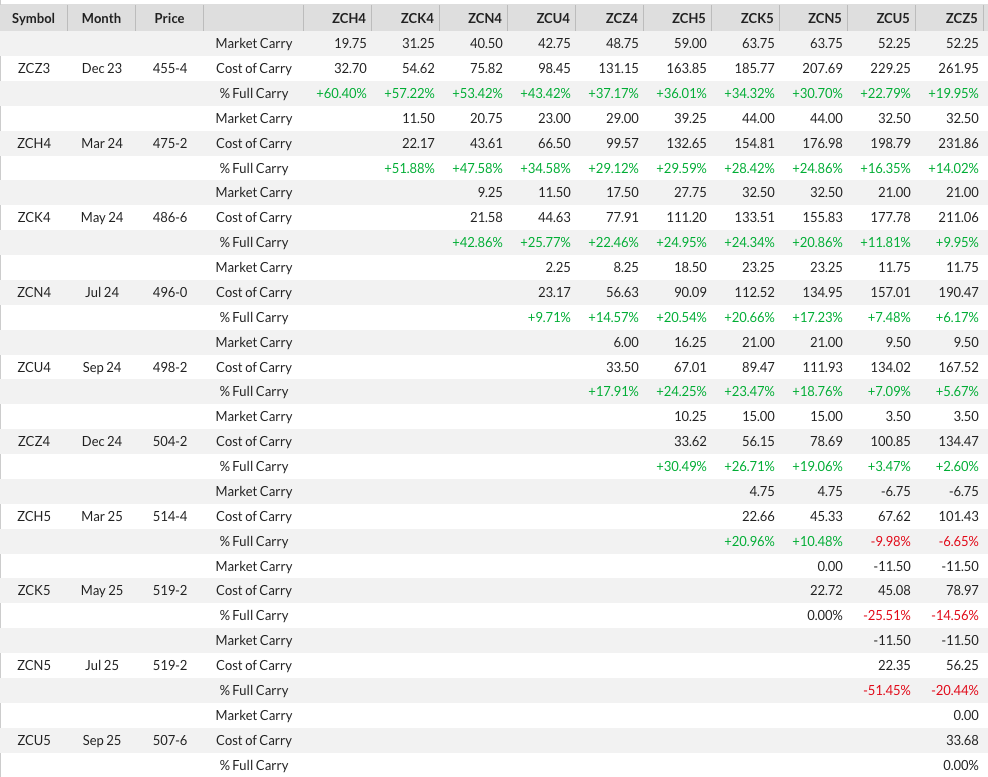
As for futures spreads, we continue to see the carry slowly strengthen in the corn market. At the end of October the Dec-March spread showed a carry of 14.25 cents and covered nearly 45% calculated full commercial carry (cfcc), while the March-May was at 8.75 cents carry and 41% cfcc. Fast forward to last Friday, in late November, and the two spreads were 19.25 cents (59%) and 12.0 cents (54%) respectively. In other words, commercial traders have been selling along with the noncommercial side, with Dec23 futures (ZCZ23) down 15.5 cents and March24 (ZCH24) off 10.5 cents for the month.
According to its 5-year index, the NCPI tends to gain 26% from the first weekly close of September through the first weekly close of June. In 2023-2024 we’ve seen the NCPI move to a contra-seasonal selloff following the third weekly close of October at $4.6618. Since then, the NCPI is down about 6% at a time when it tends to add 4%. Recall seasonality is a guide rather than a hard and fast trading rule, and when we see a contra-seasonal move it tells us something has changed fundamentally. In this case, again based on our study of the NCPI, basis, and futures spreads we know supplies have increased in relation to demand at a time when they tend to decrease. At least over the past 5 years.
What is the corn market telling us then? If one wants to be bullish, that’s fine, but the market is giving no indication it is going to turn and go up any time soon. Both commercial and noncommercial traders are selling, for now, though the latter group could change its mind at any time. When they do we need to keep Newsom’s Market Rule #6 in mind: Fundamentals win in the end.
On the date of publication, Darin Newsom did not have (either directly or indirectly) positions in any of the securities mentioned in this article. All information and data in this article is solely for informational purposes. For more information please view the Barchart Disclosure Policy here.
/Micron%20Technology%20Inc_%20logo%20on%20building-by%20vzphotos%20vis%20iStock.jpg)


