
- The Barchart National Corn Price Index, the intrinsic value of the market, looks to have hit a tipping point this past April.
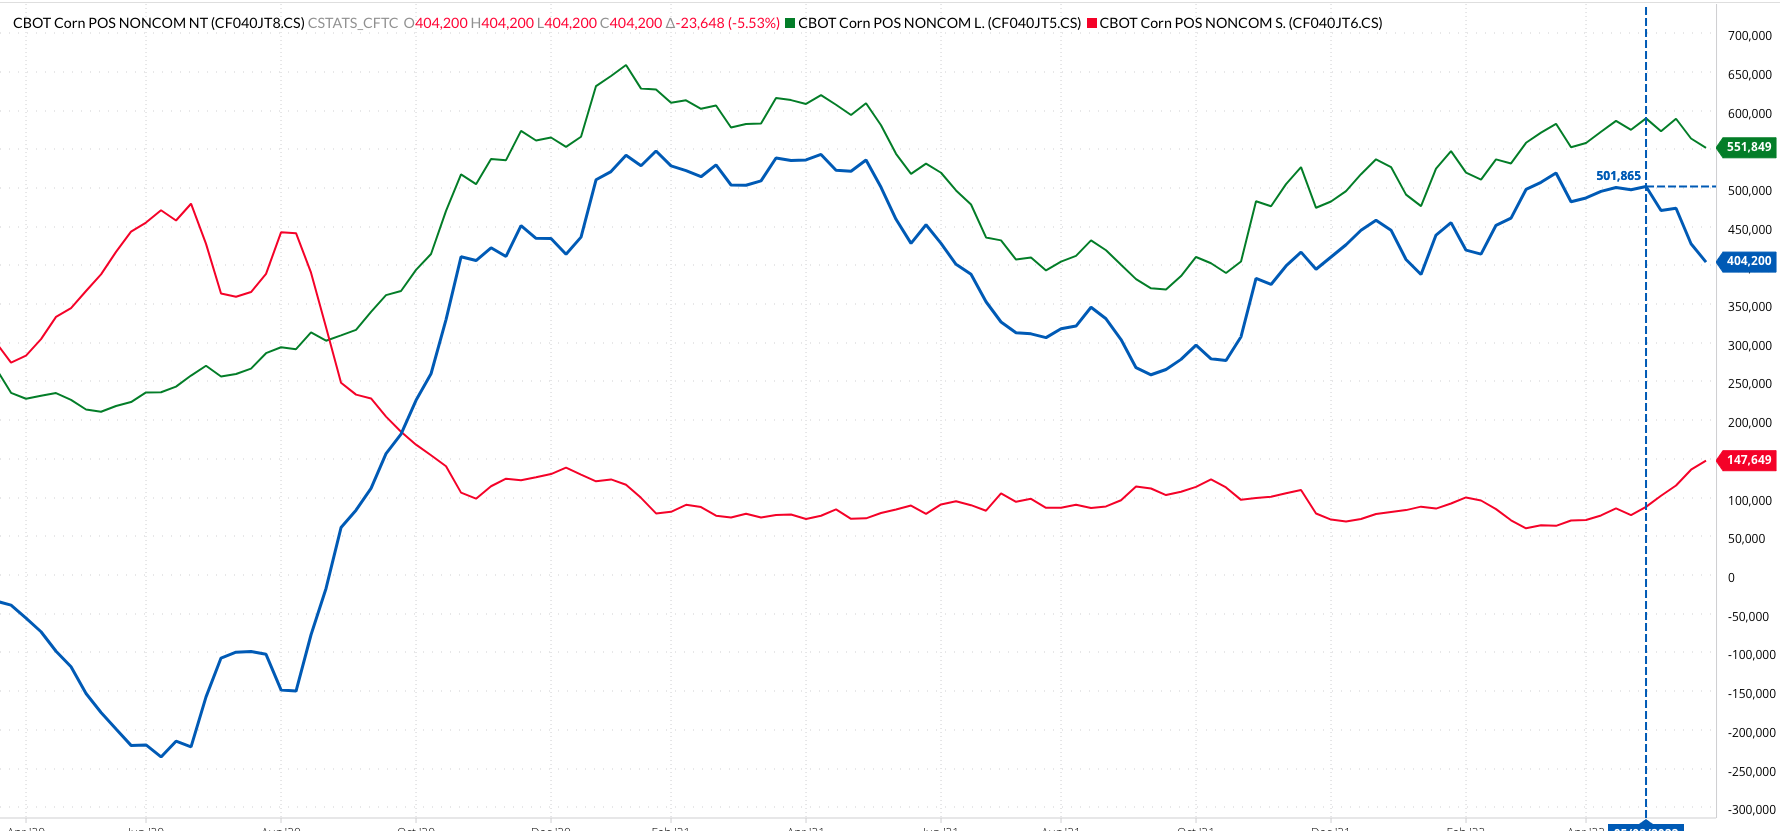
- Noncommercial traders continue to sell corn while short-term and long-term fundamentals continue to grow more bullish.
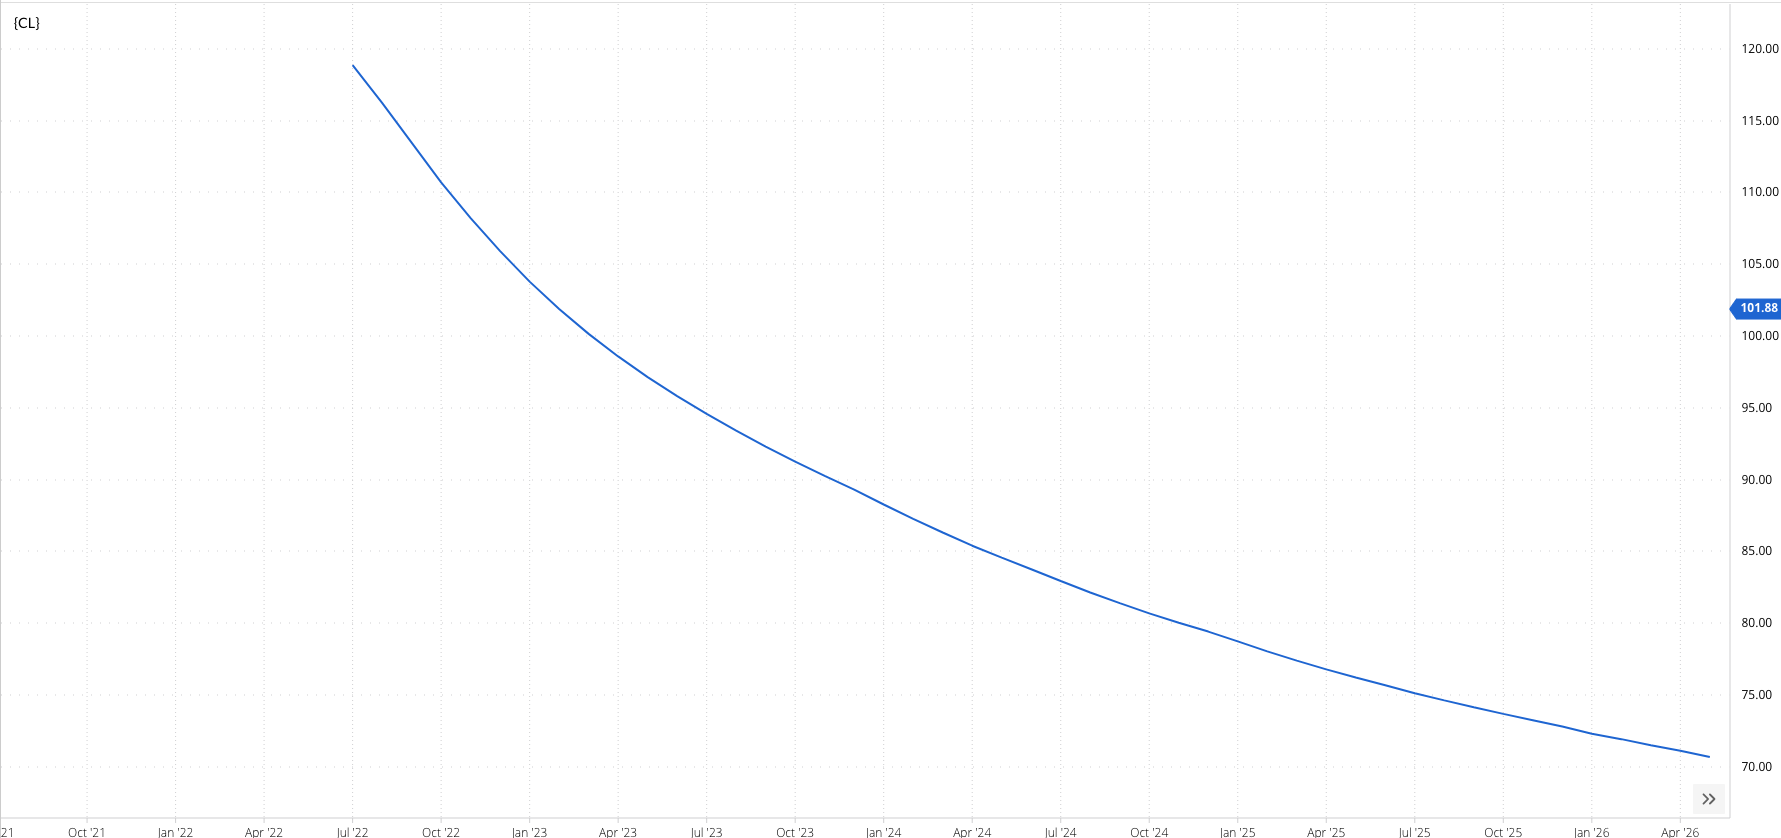
- We've seen this situation play out recently in the crude oil market, with investment buyers returning due to the market's backwardated forward curve.
Since moving to Omaha in January 2004, I’ve watched the rise and fall of King Corn’s empire. I’ve documented its climb to incredible highs, only to see it fall to life on the streets as it waited for the mysterious Godot (of the Samuel Beckett play Waiting for Godot, not the actress Gal Gadot). Recent activity tells us Godot finally arrived, lifting King Corn to new all-time highs, until…
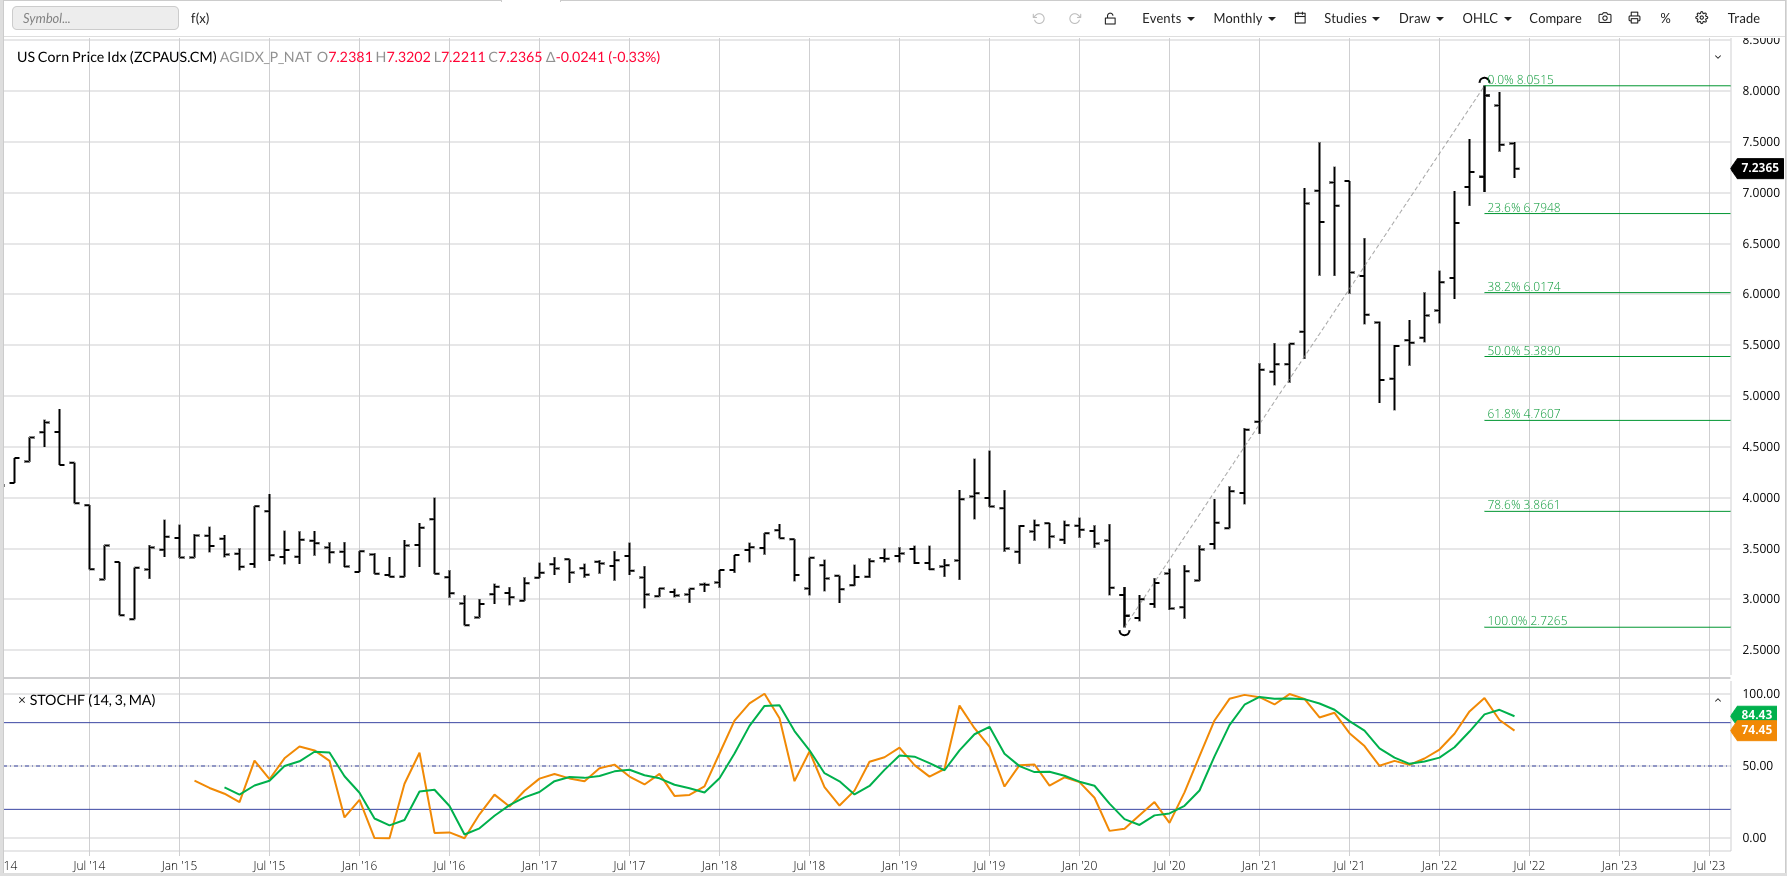
…the Tipping Point[i]. One of my key reads on grain and oilseed markets is Barchart National Price Indexes (weighted national average cash prices), what I consider the intrinsic values of the various markets, with none more important than corn (ZCPAUS.CM). A look at the NCPI’s long-term monthly chart shows us a clear tipping point, fitting enough given corn’s characteristic Round Number Reliance[ii] near the $8.00 mark. The NCPI hit a high of $8.05 during April before falling to a low near $7.40 during May. The first few days of June have seen the NCPI extend its break to near $7.15, with the next big round number of $7.00 getting clearer on the horizon.
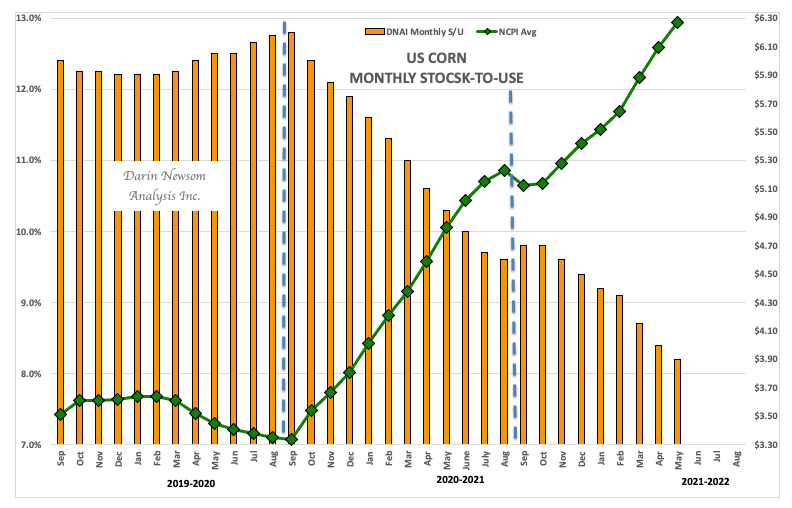
Where is the pressure in corn coming from? At the end of May, my calculation of US available stocks-to-use[iii] came in at 8.2%, as compared to the previous month’s 8.4% and the previous marketing year’s ending stocks-to-use of 9.6%. In other words, old-crop corn’s bottom-line fundamentals continue to grow more bullish. Meanwhile, weekly CFTC Commitments of Traders reports[iv] show noncommercial traders liquidated nearly 100,000 contracts of their net-long futures position during May.
Why? Because the story of tight supplies got stale, and as the old saying goes, “Bulls need to be fed every day.” As May progressed noncommercial attention turned to new-crop, knowing full well the 2022 crop would mostly be planted at some point. Now that the calendar page has turned to June, the start of meteorological summer, we have normal seasonal weather issues to deal with.
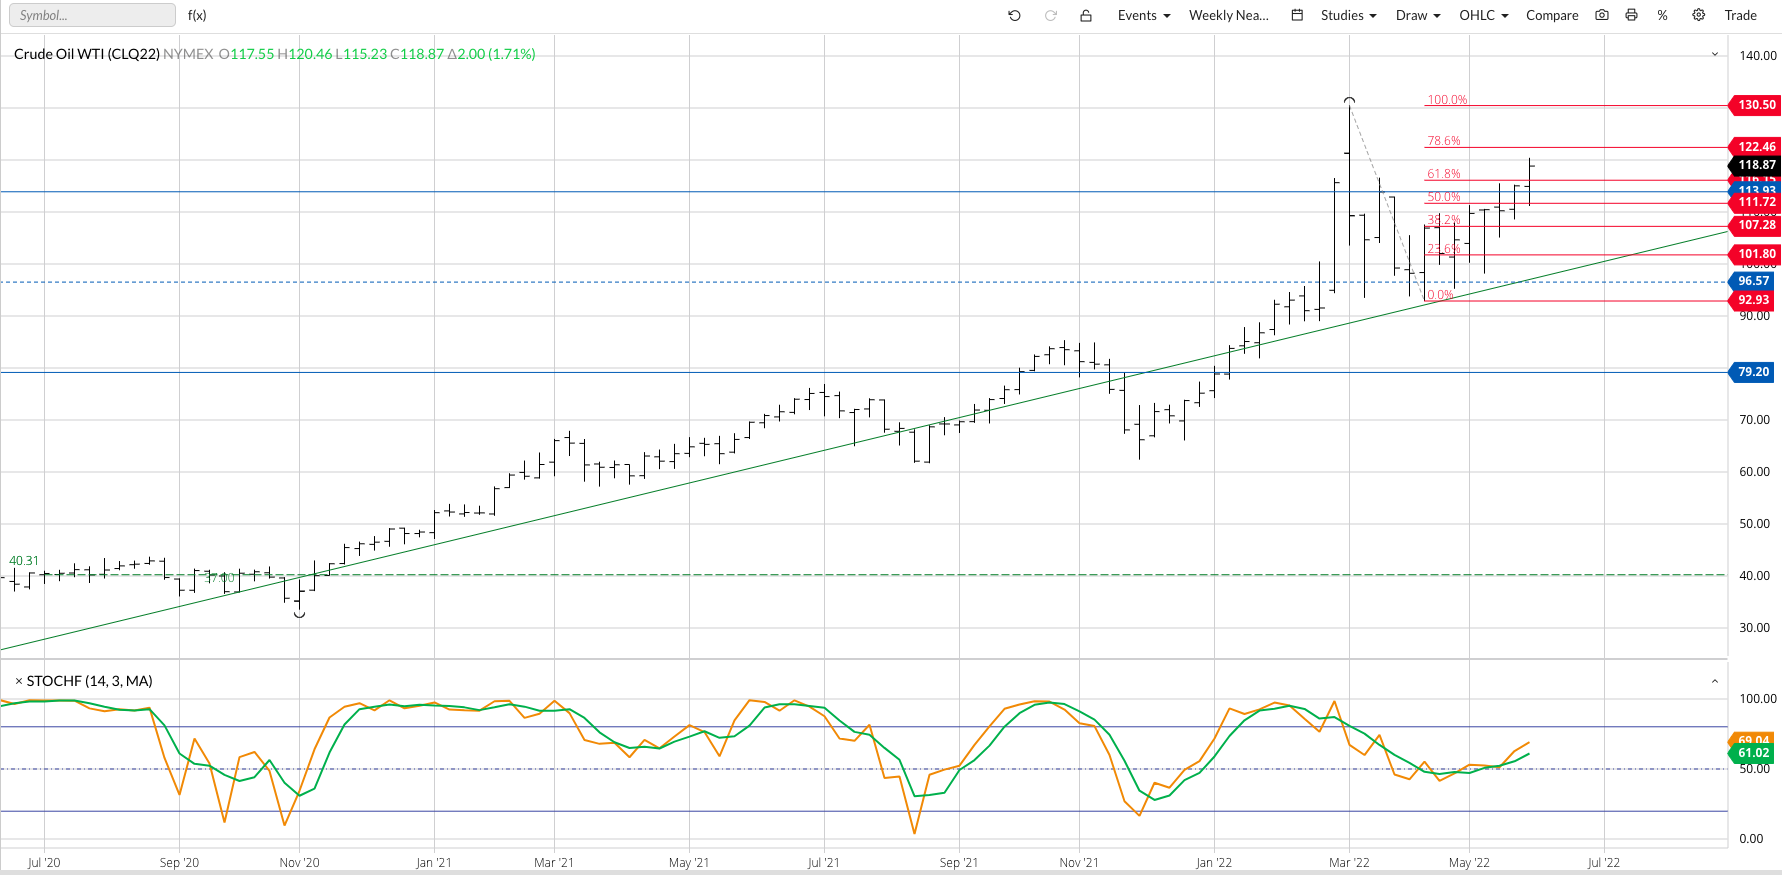
It’s always interesting when we see a divergence between noncommercial activity and the commercial view of fundamentals. I call this divergence a Rubber Band Disposition[v], a situation that recently played on in another King of Commodities – Crude Oil ((CLN22). While bullish long-term fundamentals never wavered, the spot-month contract fell from a high of $130.50 (oddly enough, near a big round number) the week of March 7 to a low of $92.93 the week of March 11. This was a drop of 29% in slightly more than a month’s time. Since then, the spot-month contract has rallied back to a high of $120.46 this week (crude oil really seems to like round numbers as well), as its forward curve remains inverted and noncommercial traders are buying back in.
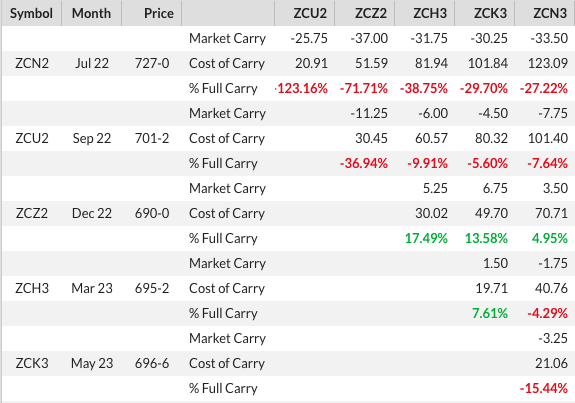
As I mentioned in a previous article, crude oil could be a template for other markets that continue to show bullish long-term fundamentals. Corn is just such a market, with the new-crop Dec22-July23 futures spreads closing Friday at a carry of 3.5 cents and covering a bullish 5% calculated full commercial carry[vi]. Given this, the argument could be made noncommercial buying will return to corn at some point, but at what price? Theoretically, if the NCPI sees the same 29% drop crude oil posted it would project a target near $5.70. That’s a long way down. Technically, given market fundamentals remain bullish, the initial downside target on the NCPI’s monthly chart is near $6.01 (round numbers again anyone?)
[i] The Tipping Point is another great book by Malcom Gladwell. The theory is markets, or other trends in everyday life, move so far one direction it runs out of momentum and plummets back the other direction. Given all the talk of inflation, not just in the US but globally, the question is when does post-pandemic demand hit a tipping point?
[ii] Corn’s Round Number Reliance is its tendency to move from round number to round number, looking for support and resistance. The bigger the round number (dollars as opposed to cents), the more important that support or resistance might be.
[iii] Recall my calculations are based on analysis of those same Barchart National Price Indexes, in the case the NCPI.
[iv] I look at legacy, futures only. I know most of the industry is enamored with the diaggregated reports that include option positions, and to the throng I remind option positions are put in place for a number of reasons (mostly Greeks) other than traders being bullish or bearish.
[v] A Rubber Band Disposition develops when commercial and noncommercial traders move in opposite direction. A market is stretched, like a rubber band, before it snaps. Usually this means it returns to its base, its fundamentals, as Newsom’s Market Rule #6 tells us, “Fundamentals win in the end”.
[vi] A long time ago in a galaxy far, far away (Kansas), I developed a table that broke calculated full commercial carry into thirds. This means 33% or less should be considered fundamentally bullish.
/The%20sign%20for%20Marvell%20Technology%20out%20front%20of%20a%20corporate%20office%20by%20Valeriya%20Zankovych%20via%20Shutterstock.jpg)

/Intel%20Corp_%20badge%20holder-by%20hasrul_rais%20via%20Shutterstock.jpg)

