
At the core, information is only truly transmitted when the person receiving the intelligence enjoys a change in posterior thinking relative to prior beliefs. Within this transmission, there are two main categories: degenerate and non-degenerate.
Understandably, these terms carry a loaded meaning in the financial ecosystem. However, from a mathematical and decision-theoretic standpoint, the distinction comes down to information quality. Essentially, a degenerate decision rule is one that ignores state information and always produces the same action. In effect, degenerate rules are rules in the formal sense but they’re not informative.
By contrast, a non-degenerate rule requires structure, discrimination, calibration or predictive power. This standard implies measurable or objective uncertainty reduction — and as such excludes pure persuasion without truth linkage.
For example, if you were on the fence about buying fictional ABC Semiconductor stock and my analysis centered solely on analysts liking the name, this might convince you to go ahead and buy ABC. However, the decision to buy would be based on degenerate information transmission. Rather than a substantive analysis, you would have bought on a social proof signal, a coordination cure and/or a permission structure.
Nothing about analysts liking ABC reflected new state information about the company’s future cash flows, nor a probability distribution over outcomes nor a conditional framework which narrowed the range of likely scenarios. Such protocols would be examples of non-degenerate information transmission, where uncertainty is reduced through empirical or objective mechanisms under a conditional context.
For this article, we will look at three potentially discounted stocks to buy by examining their underlying first-order analytics. Next, we will layer a second-order analysis to identify potential zones of probability from the original list of possibilities.
Amazon (AMZN)
Amazon (AMZN) isn’t off to a great start for the new year, with the security losing 9% of equity value. Nevertheless, this performance doesn’t seem to be dissuading the smart money, at least when looking at volatility skew, one of the many screeners available for Barchart Premier members. This tool represents one of the most important first-order analytics because it showcases implied volatility (IV) across the strike price spectrum of a particular options chain.
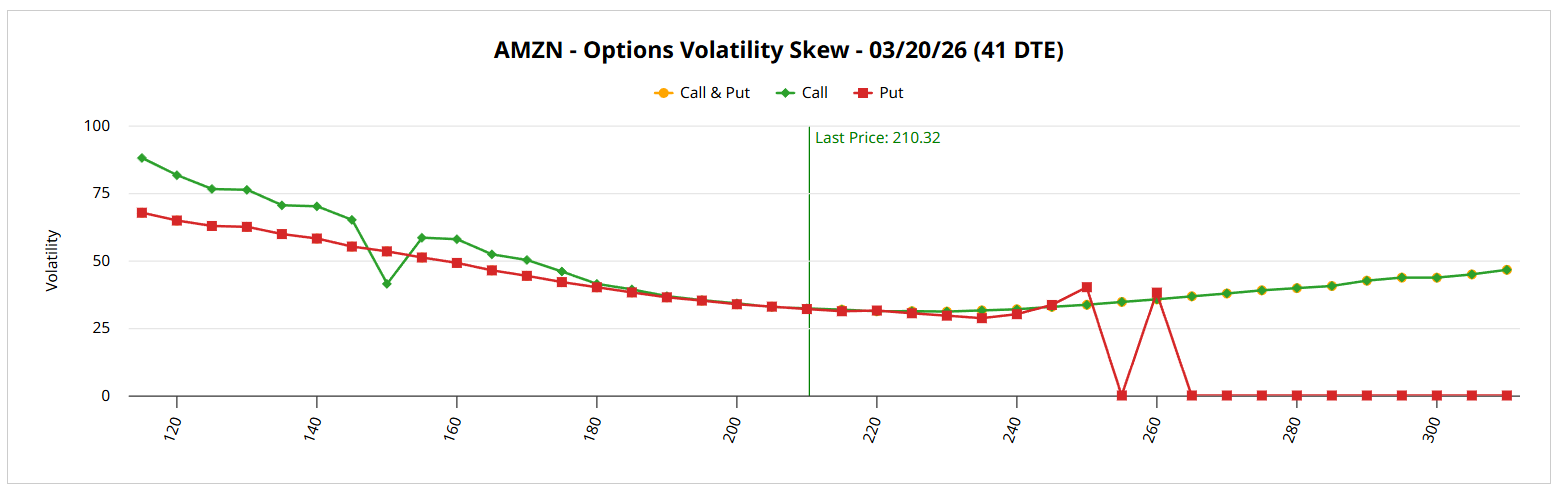
For the March 20 expiration date, volatility skew shows call IV elevated above puts at both ends of the strike spectrum. This setup signals that the main prioritization is upside volatility protection. In effect, the smart money believes that the cost of missing out on upside expression is more injurious than not protecting against downside movements.
In other words, the market expects AMZN stock to perform poorly due in part to weak technical signals. As such, if more selling materializes, the magnitude would be much less than if an unexpected upswing occurs. The smart money recognizes that it’s worse to be caught sleeping on the upside — and therefore the skew reflects anticipated optimism.
For the March 20 date, the Expected Move calculator calls for a dispersion between $194.94 and $225.71. While this is an insightful list of possibilities, as debit-side traders, we’re incentivized to narrow this range down as much as possible. That’s where the Markov property comes into view, which states that the future state of a system depends entirely on the current state.
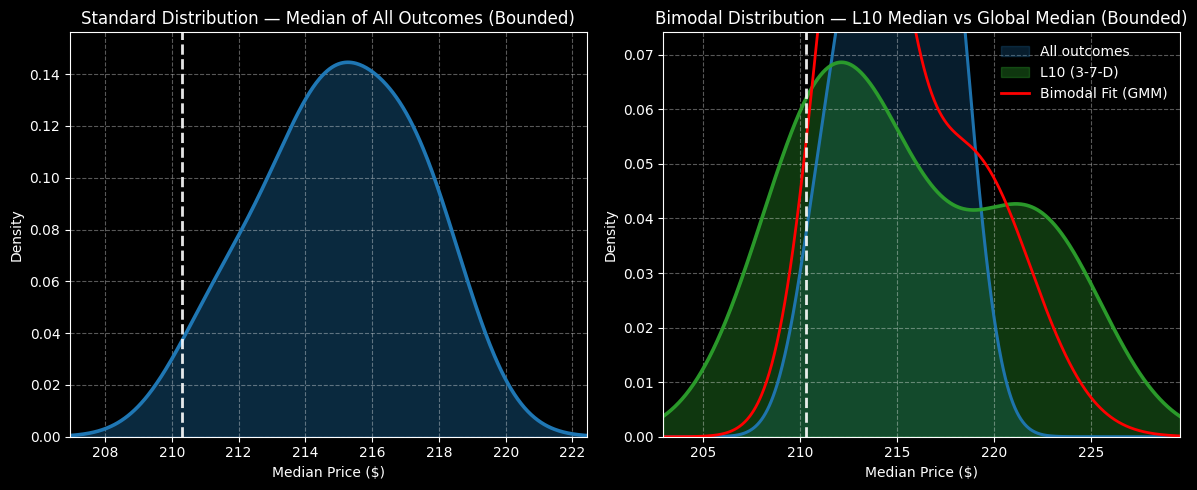
Right now, the current context is that in the last 10 weeks, AMZN stock printed only three up weeks, leading to an overall downward slope. Using enumerative induction and Bayesian-inspired inference, we expect under 3-7-D conditions that AMZN will range between $200 and $230, with probability density peaking near $212. However, density will likely remain relatively elevated until $223, when a noticeable drop-off occurs.
Given the market intelligence above, I’m liking the 215/220 bull call spread expiring March 20.
Chewy (CHWY)
Chewy (CHWY) is another name that has gotten off to a slow start, with CHWY stock losing more than 15% since the beginning of January. This situation is a bit different than Amazon’s, especially when you consider volatility skew. For the March 20 expiration date, the main priority among smart money traders is downside risk management. At the same time, there’s potentially an opportunity for contrarianism.
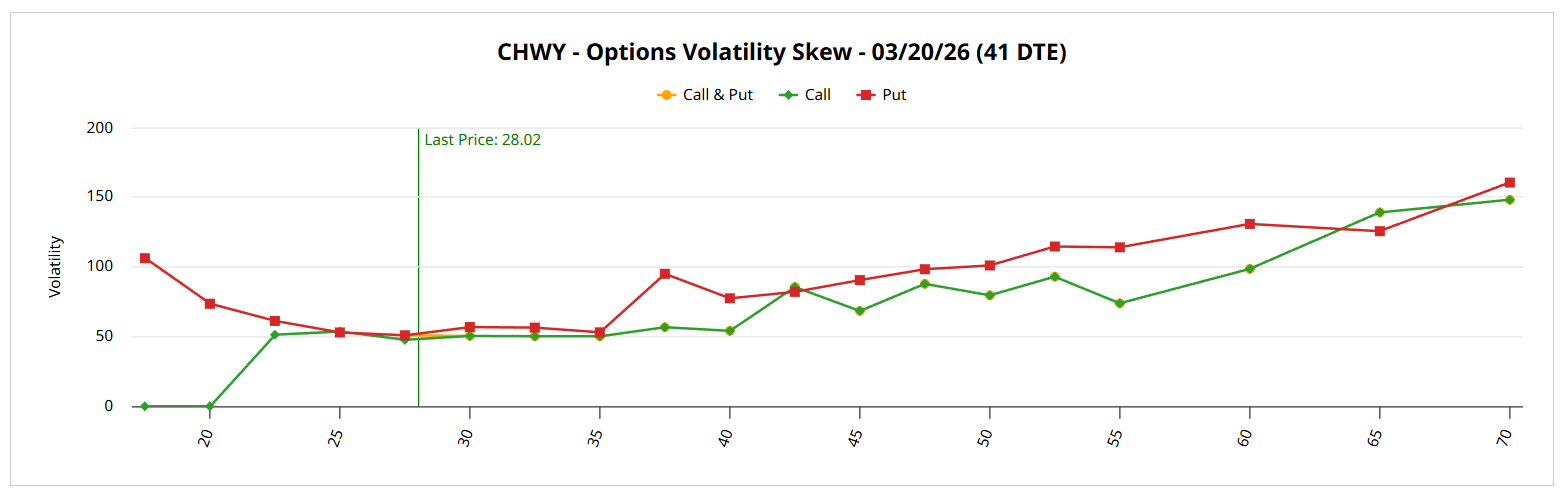
First, the skew shows that put IV is generally more elevated than call IV, especially at the edges of the strike price boundaries. On the left side, the out-the-money (OTM) puts reflect heightened demand for insurance against tail risk while the deep in-the-money (ITM) puts imply a mechanical short position, possibly to protect long exposure to CHWY stock.
Still, what’s interesting is the volatility skew’s nuanced profile. Call IV curves upward toward the further OTM strikes, which suggests that the possibility of upside tail risk is a non-trivial one. As such, the posture is not entirely downside protective, which could potentially be a significant clue.
Looking at the Expected Move calculator, the Black-Scholes-derived model is projecting a dispersion between $24.88 and $31.16 for the March 20 expiration date. Again, this is a range of possibilities rather than a list of probabilities. To narrow the list, we need to turn to a second-order Markov analysis.
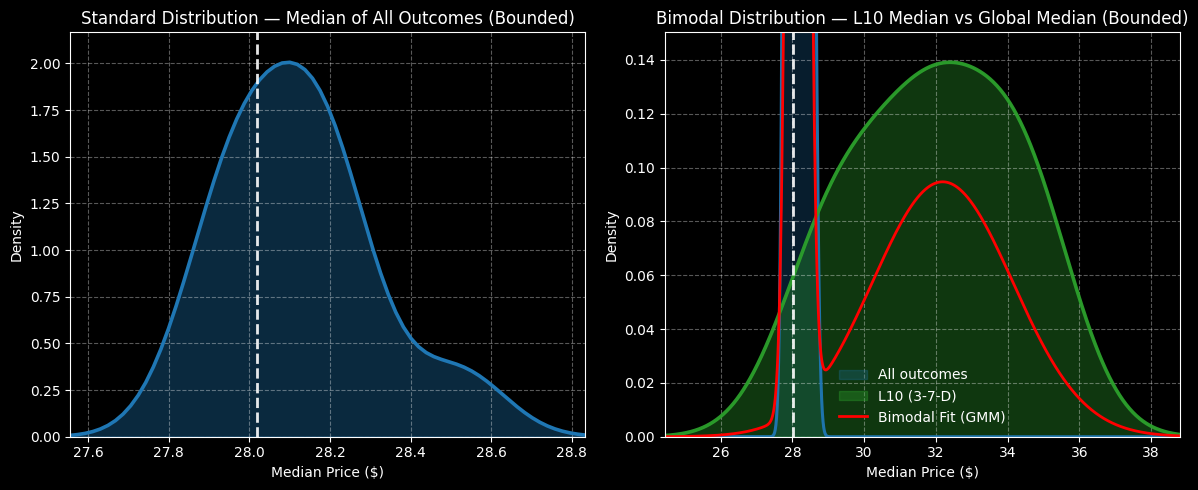
Right now, the quantitative context is that CHWY stock is also structured in a 3-7-D formation. Under this signal, we may expect CHWY to range between $25 and $39 over the next 10 weeks, with probability density peaking near $32.
Based on the information above, I’m very tempted by the 30/32.50 bull call spread expiring March 20.
Expedia Group (EXPE)
Finally, Expedia Group (EXPE) rounds out our list of beaten-up securities that could be due for a comeback. Currently, EXPE stock is labeled as a Weak Buy by the Barchart Technical Opinion indicator. However, it doesn’t really seem like an opportunity, especially with EXPE down more than 16% year-to-date. Still, a look at volatility skew reveals an intriguing setup.
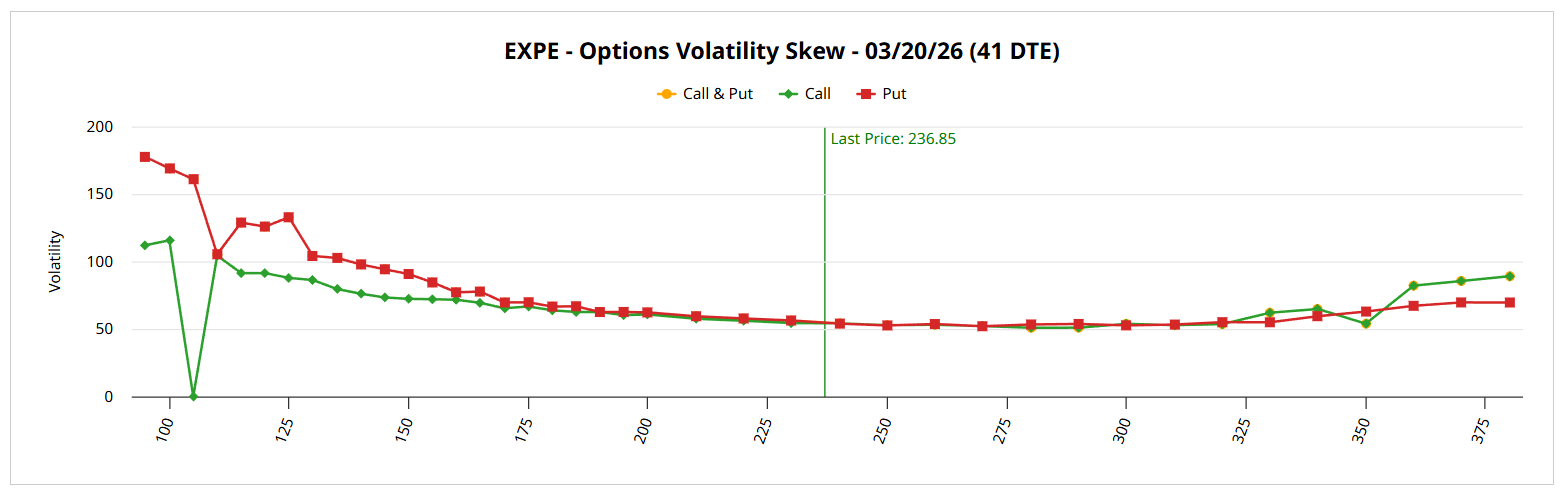
Overall, when looking at the broader curvature for the March 20 expiration date, the priority among sophisticated market participants seems to be downside volatility protection. In particular, put IV is conspicuously elevated above call IV at the lower strike price boundaries. This dynamic suggests that the smart money is mainly concerned about insuring against tail risk.
But on the other end of the spectrum, call IV rises above put IV, which tells us that there’s a perceived non-trivial risk that EXPE stock can shoot upwards. In other words, while there’s clear incentive to protect against the floor falling out, there’s simultaneously demand for upside expression, just in case.
Looking at the Expected Move calculator, the Black-Scholes-derived model projects a range between $207.55 and $266.15 for the March 20 options chain, representing a sizable 12.37% high-low spread relative to the current spot price. Again, while we have a list of possibilities, we’re trying to narrow this down to probabilities.
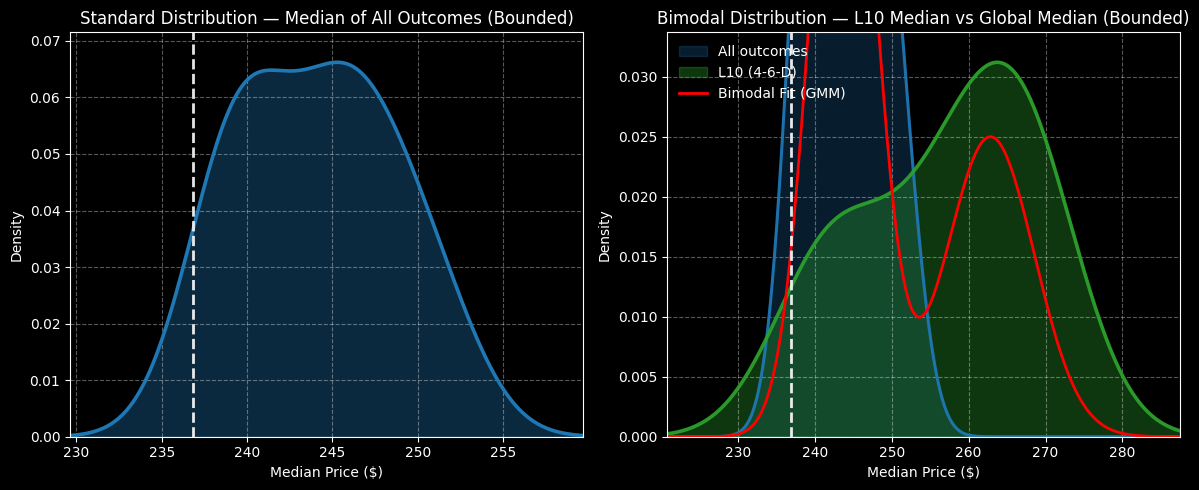
Currently, the quant context is that EXPE stock has printed a 4-6-D sequence. Under this condition, we would expect shares to range between $220 and $290 over the next 10 weeks, with probability density peaking around $262.
Given the information above, the 250/260 bull call spread expiring March 20 could be enticing for speculative traders.
On the date of publication, Josh Enomoto did not have (either directly or indirectly) positions in any of the securities mentioned in this article. All information and data in this article is solely for informational purposes. For more information please view the Barchart Disclosure Policy here.

/Microsoft%20headquarters%20By%20Peter.jpeg)
/Apple%20products%20on%20desk%20by%20Ake%20Ngiamsanguan%20via%20iStock.jpg)
/Nvidia%20logo%20by%20Konstantin%20Savusia%20via%20Shutterstock.jpg)
