
- Just over a month ago, the spot-month WTI crude oil contract hit $130.50, its highest price since July 2008.
- Market fundamentals were incredibly bullish as the Inverse (backwardation) stretched to more than $4.00.
- But as tends to happen, the flow of money from both noncommercial and commercial traders had changed and did changed, resulting in a change in trend as well.
I was invited to be the guest Monday on RFD Radio’s Profit Watch program, and I always look forward to visiting with my friend and host DeLoss Jahnke. I’ve been talking to DeLoss for a number of years, so I greatly appreciated the fact he stayed away from the subject I said I wouldn’t mention again in this space last week. Instead, we talked about real market fundamentals, mostly corn and soybeans, and as we made our way through the conversation a great drinking game would’ve been to take a shot of your favorite adult beverage every time I said the word “bullish”. Yes, this is vastly different than when I used to appear on a weekly ag television show and was famous for always being bearish. But that’s what a change in the structure of markets will do to someone who reads markets for a living rather than having pre-determined opinions.
Then DeLoss asked the key question, “At what point, with everything about a market bullish, does the market stop being bullish?”
It cut to the core of what studying market structure is all about, what most of Newsom’s Market Rules address. The activity in a market changes, it always has and always will, and what we have to do is see it when it begins to happen. We won’t know why, but we’ll be able to see the what, or in other words, Newsom’s Market Rule #5. With all that as background, the first thing that came to my mind was WTI crude oil (CLK22).
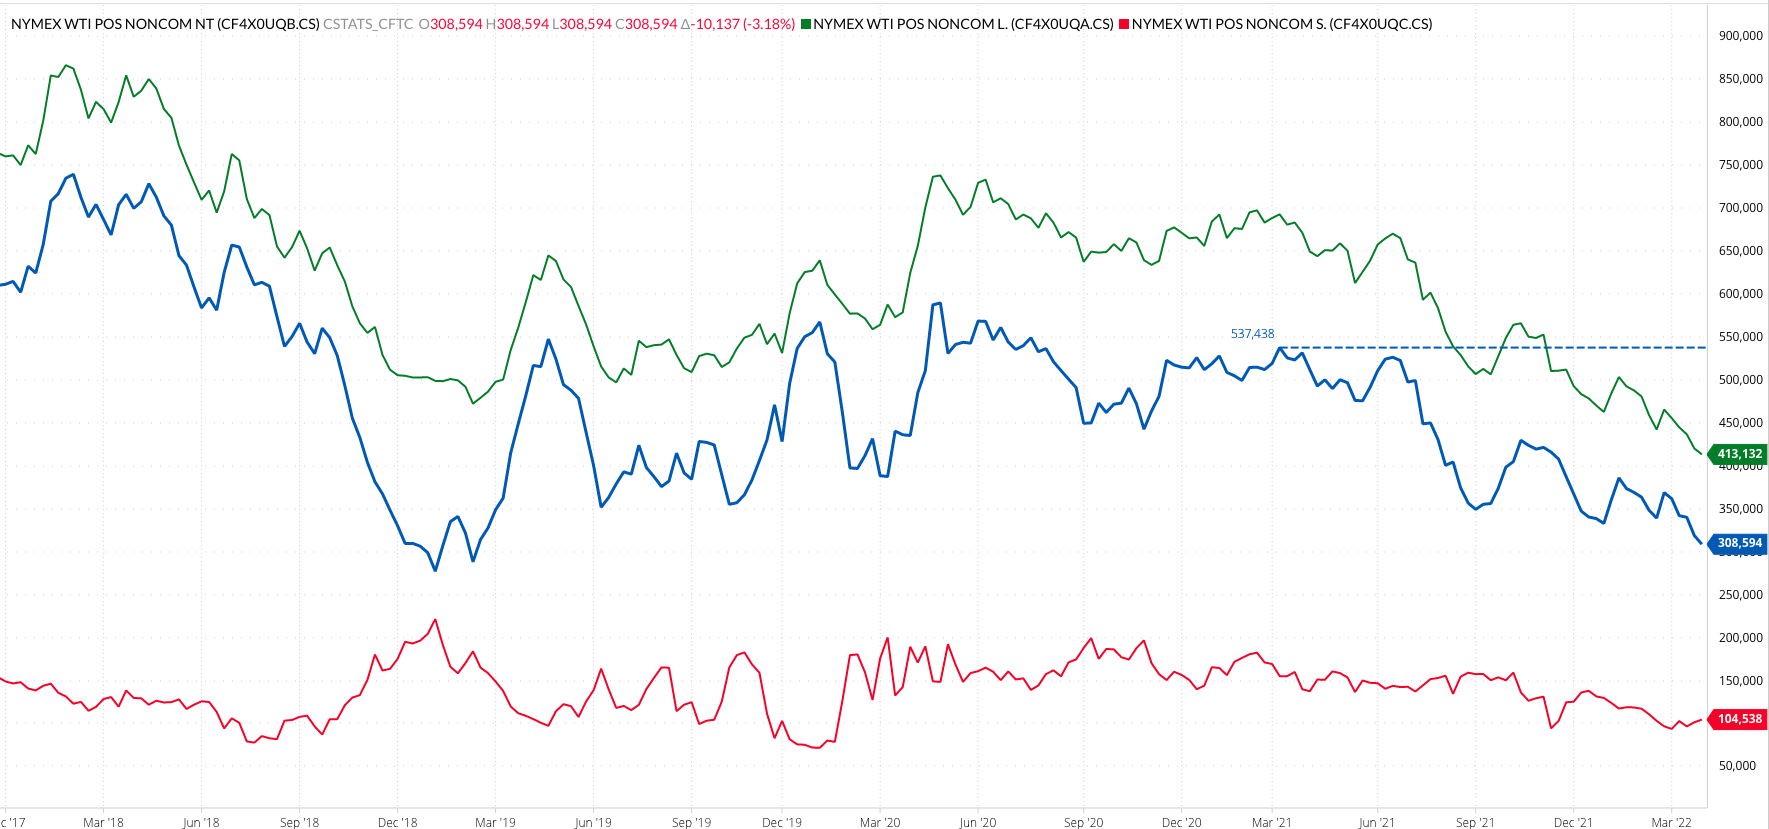
Here is a market that, like corn and soybeans and so many others, was bullish every way one looked at it a few weeks ago. Or so we thought. As the spot-month contract hit $130.50 on March 7, the buying suddenly dried up. The reality is the market had been losing noncommercial buying interest for a year with its CFTC Commitments of Traders report (legacy, futures only) net-long futures position (blue line) topping out at 537,438 contracts the week of March 8, 2021. This past Friday the same position was reported at 308,594 contracts (for the week ending Tuesday, April 5). The biggest part of position change has been long liquidation (green line).
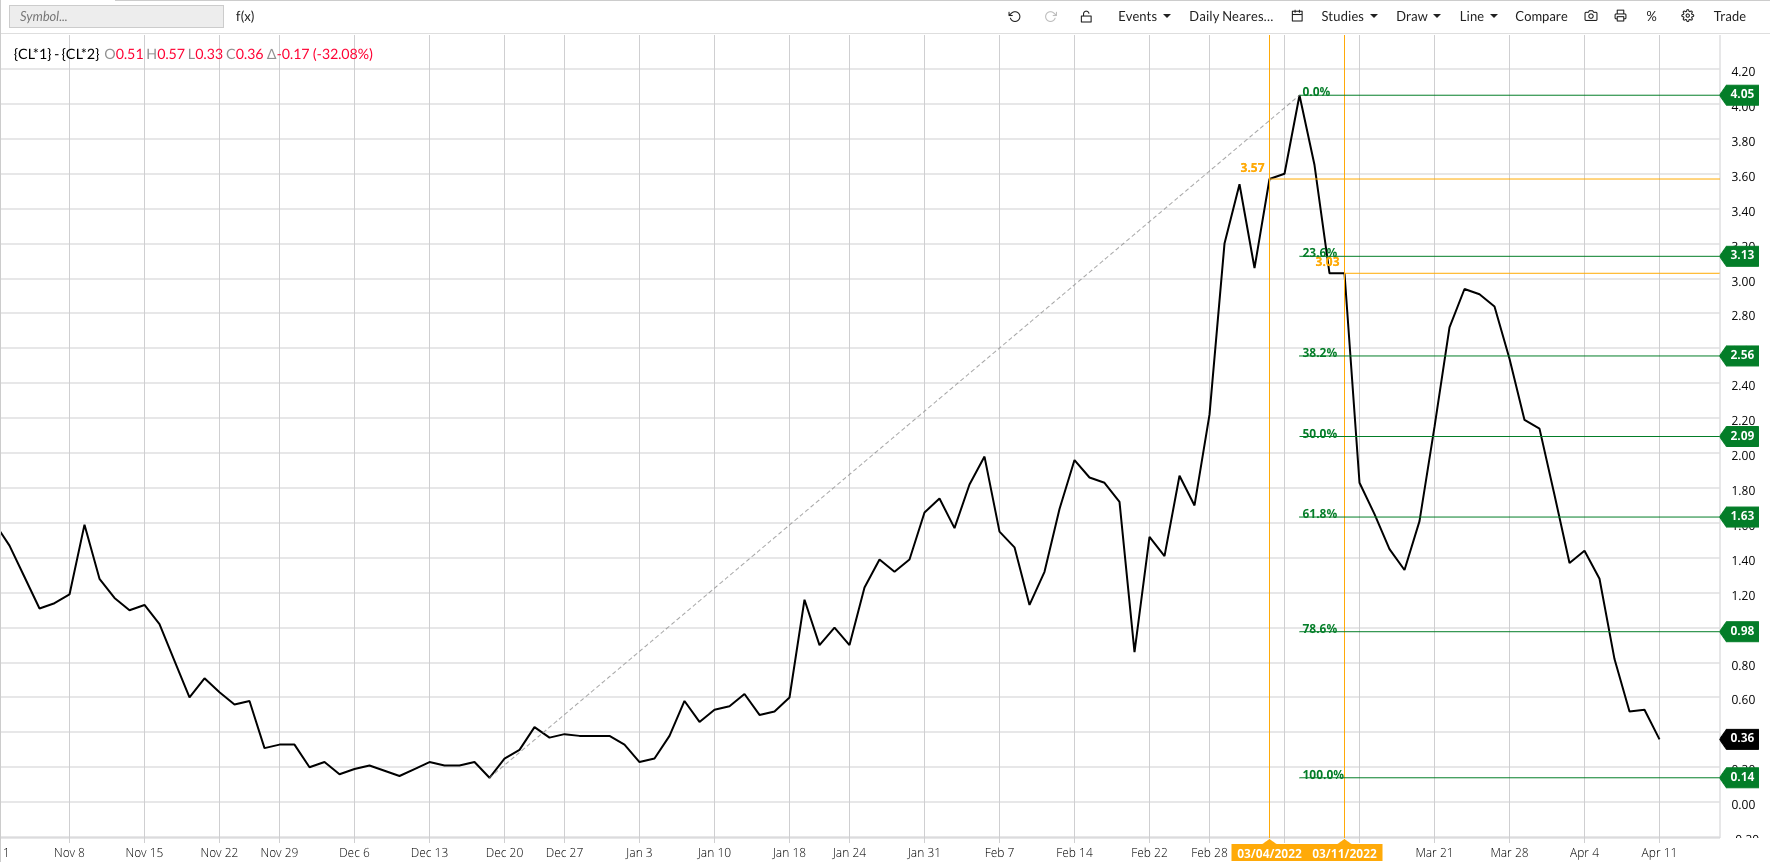
If noncommercial traders have been selling for a year, then what drove the market to its highest price since July 2008? Commercial buying. The spot spread rallied from a low of 14 cents inverse (backwardation for the New Yorkers in the crowd) on December 17, 2021, to a high of $4.05 inverse on March 8, 2022 (note the date). Since then, the spot spread has posted a solid 3-wave downtrend on its daily close-only chart to Monday’s close near 30 cents. As we all know by now, an inverse (again, backwardation) in a storable commodity reflects bullish fundamentals, so technically crude oil’s supply and demand is still tight. Just not as tight as it was before, with folks across the industry happy to make up reasons why.
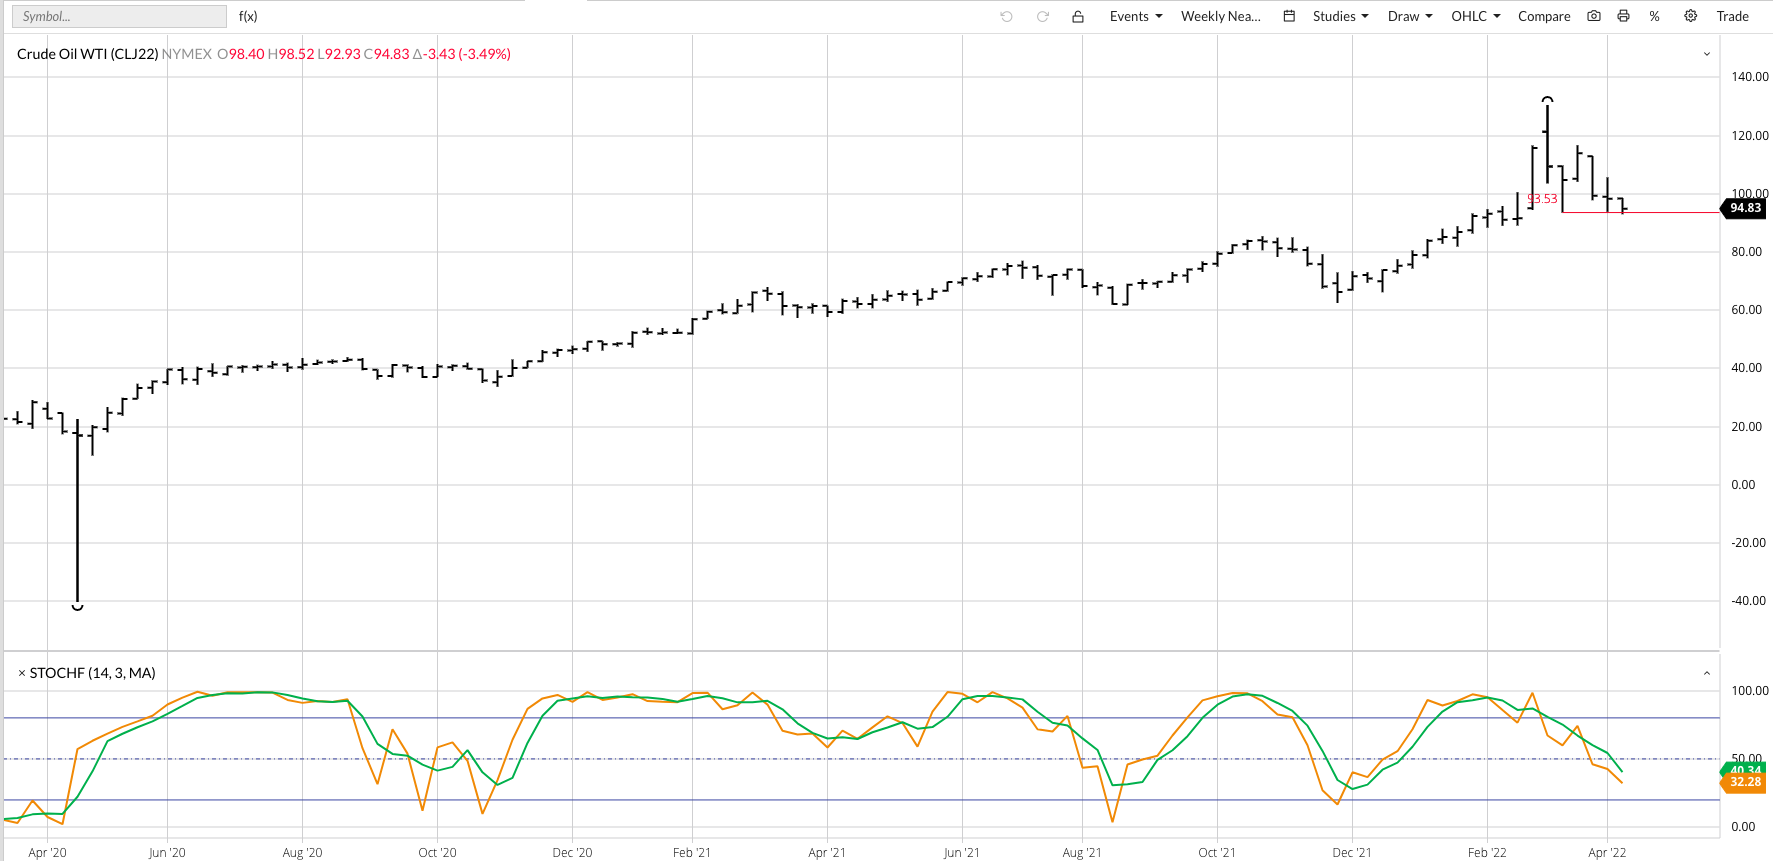
The bottom line is market structures change, trends change, as the money flow changes. Crude oil fell to its lowest level since the week of February 22 because things changed. How far might crude oil fall? I have no idea, but we will likely get a good idea a low is forming when we start to see the flow of money go back the other direction.
Read more Energy News on barchart.com
/The%20sign%20for%20Marvell%20Technology%20out%20front%20of%20a%20corporate%20office%20by%20Valeriya%20Zankovych%20via%20Shutterstock.jpg)

/Intel%20Corp_%20badge%20holder-by%20hasrul_rais%20via%20Shutterstock.jpg)

