
- The annual folly of NASS' weekly crop condition and progress updates started this week, and as one would expect the initial condition numbers for US winter wheat were low.
- I've railed against these reports for decades, pointing out the problems with them to folks at NASS and anywhere else that would listen, to no avail.
- As always, if we want to understand real crop conditions we simply have to understand what futures spreads and forward curves are telling us.
(Tap, tap, tap)…Testing. One, two, three. Is this mic on? Can you hear me okay in the back? Yes? Great.
Okay, It’s time for me to make my annual soapbox speech about the Kardashians of USDA reports – NASS’ weekly crop condition and progress updates. I’ll tell you again what I’ve told you for many years: I’ve talked to the folks who make these numbers up, and well, the numbers are simply made up. In fact, if you go back a few years to NASS’ Users’ Meeting in Kansas City the key takeaway was this quote from someone with NASS, “We know there are problems with these reports, but because they are popular we will continue to post them.” Note this doesn’t say they are real, meaning like the Kardashians there is little to no value. But they are popular. So there’s that. And as always, I wish I had a drinking game today for all the references to NASS’ initial winter wheat crop condition numbers for hard red winter (HRW) wheat. I’d rather lose brain cells to adult beverages than any mention of NASS’ numbers. (Mic drop)
Okay, that will be the last time I mention these ridiculous updates the rest of the year. But I will be talking about real crop conditions as spring slowly turns to summer and summer to fall. Just as with my preference for talking about real market fundamentals as opposed to USDA’s imaginary version, I use futures spreads to tell me all I need to know about the condition of crops and what it might mean for expected production and supplies in relation to demand. Do these spreads create condition numbers for me? Absolutely not, but it’s here I’ll remind you of another line I’ve borrowed when forced to talk about NASS’ updates. The old show “Whose Line Is It Anyway” used the phrase, “Everything is made up and the points don’t matter.”
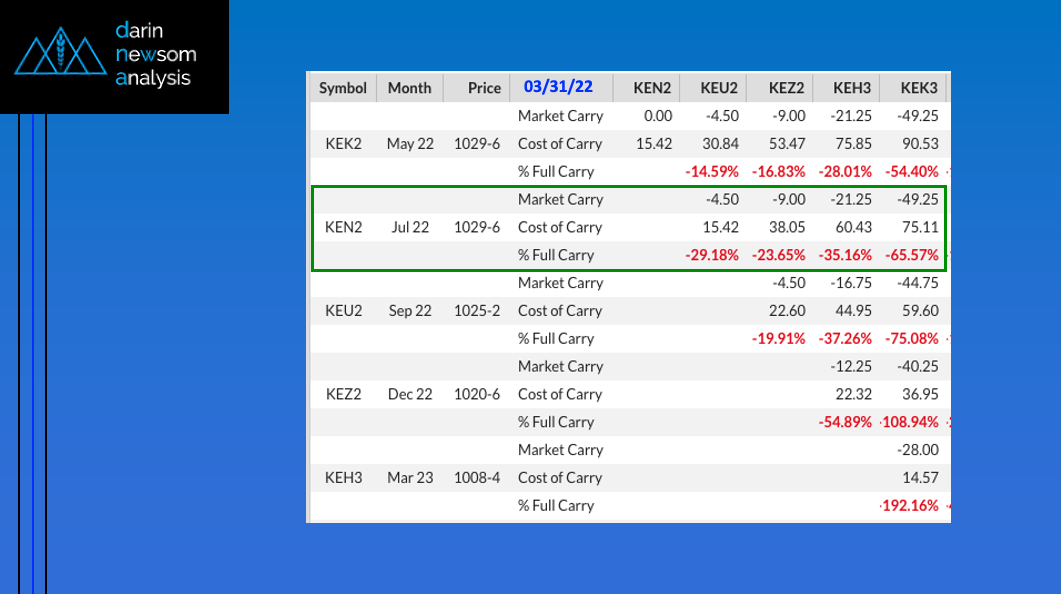
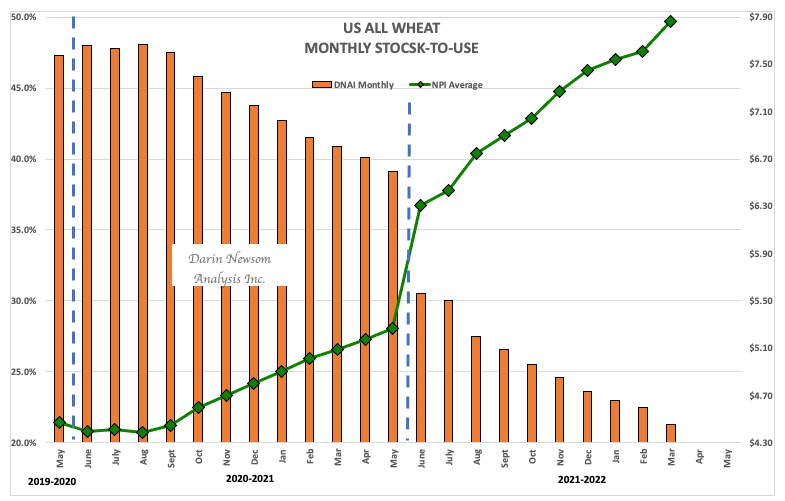
Take a look at the attached Cost of Carry table from Barchart for the HRW wheat market at the end of March. The new-crop 2022-2023 July-to-May forward curve closed at an inverse of 49.25 cents. Recall from previous discussions that in a storable commodity like wheat an inverse, any inverse, is an indicator of bullish fundamentals. So what do we know about US HRW wheat supply and demand? First, with the cmdty National HRW Wheat Price Index (KEPAUS.CM) calculated at $10.27 we know old-crop supplies are tight in relation to demand, part of my latest 2021-2022 US all wheat available stocks-to-use calculation of 21.3% as compared to my ending stocks-to-use calculation of 39.1% for 2020-2021. Second, the strong inverse in the 2022-2023 forward curve tells us the commercial is convinced supplies, the combination of beginning stocks (old-crop ending stocks) and production (acres X yield) aren’t going to be enough to offset demand and rebuild the US stockpile.
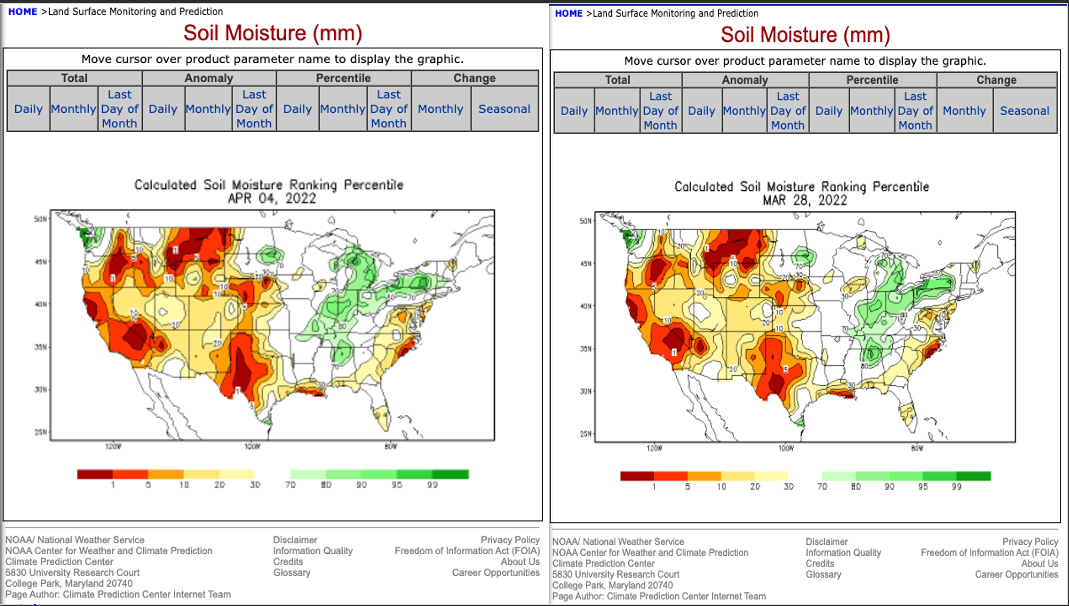
We can add depth to our conclusion by studying soil moisture maps, with the latest round showing deficits across the US HRW growing area.
It’s that simple. As I’ve long said everything we NEED to know about fundamentals is in front of us with market prices every hour of every day. But that isn’t enough for a lot of people as they continue to WANT what’s popular, regardless of how vacuous it might be.
Just like watching the Kardashians.

/Nvidia%20logo%20and%20sign%20on%20headquarters%20by%20Michael%20Vi%20via%20Shutterstock.jpg)


/Intel%20Corp_%20Santa%20Clara%20campus-by%20jejim%20via%20Shutterstock.jpg)