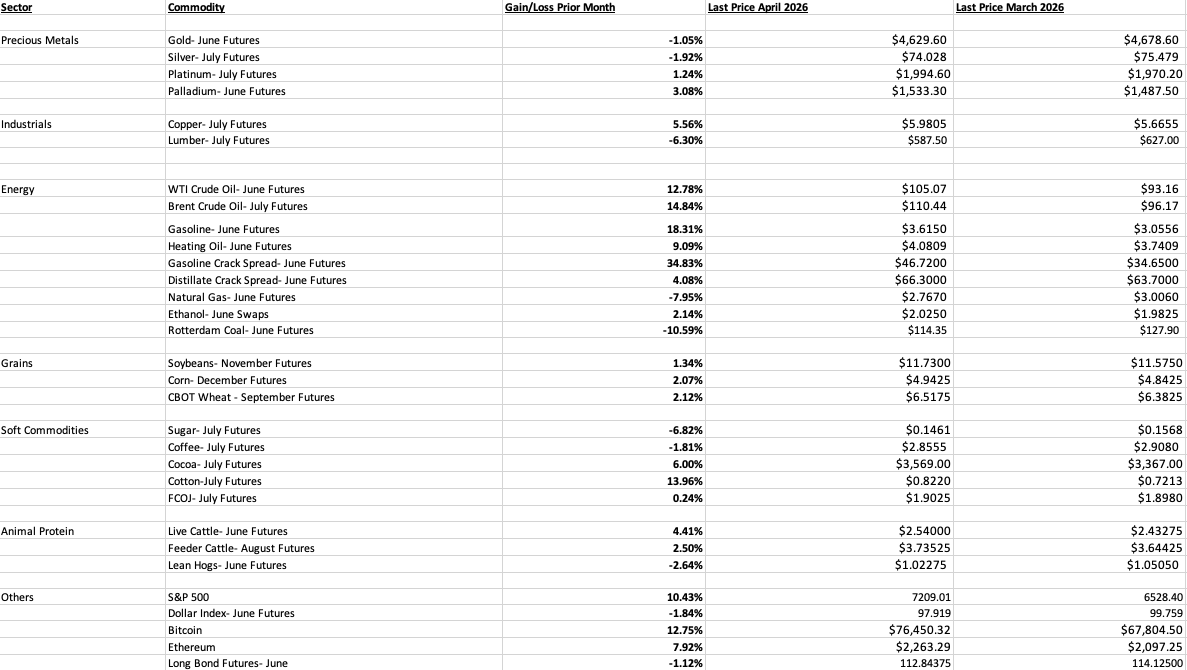
In the commodities asset class in April 2026, crude oil, gasoline, the gasoline refining spread, cotton, and Bitcoin posted double-digit percentage gains. Rotterdam coal was the only commodity that declined by just over 10%, while natural gas, world sugar futures, and lumber futures were down by over 6%. The leading stock market indices moved higher, while the long bond futures declined. The dollar index fell 1.12%. A lower dollar and higher interest rates sent mixed signals to commodities.
The war in the Middle East sent crude oil and products higher
Despite a ceasefire, tensions between Iran and the United States, closure of the Strait of Hormuz, a critical logistical chokepoint for crude oil, and uncertainty sent crude oil, oil products, crack spreads, fertilizers prices higher.
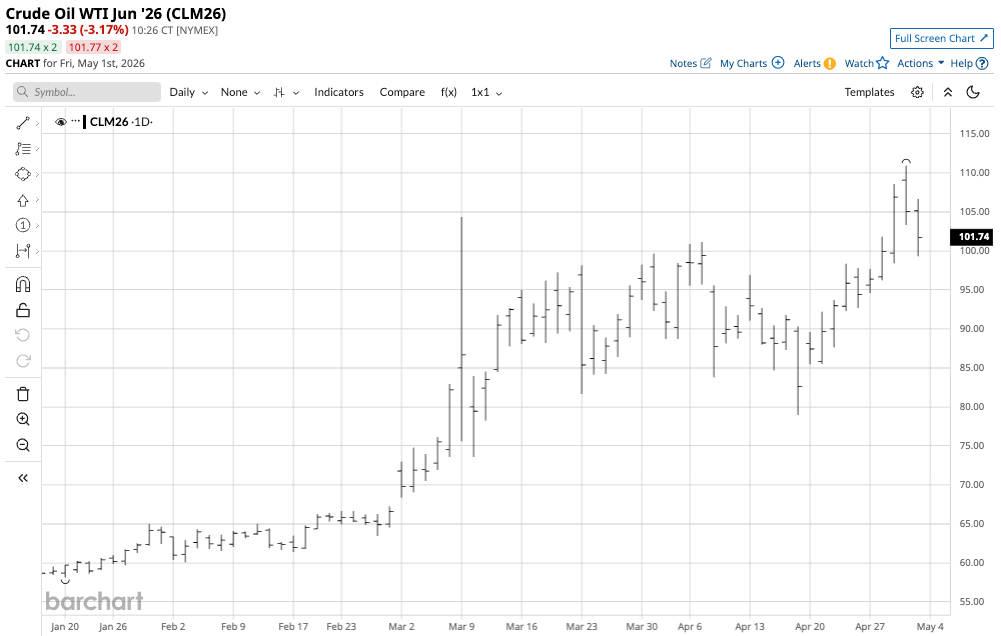
The monthly June NYMEX WTI crude oil futures chart shows that the price rose 12.78% in April. Brent crude oil, the benchmark for Middle Eastern petroleum, outperformed the WTI, posting a 14.84% monthly gain on the ICE July contract.
Gasoline futures moved 18.31% higher, while heating oil futures, which are a proxy for other distillate fuels, rallied 9.09%. The heating oil futures underperformed gasoline as the energy market moved into the 2026 driving season, the peak season for gasoline demand.
Crack spreads reflect the refining margins for processing crude oil into gasoline and distillate products. The gasoline crack spread moved 34.83% higher in April, while the distillate crack spread posted a 4.08% gain.
June Chicago ethanol swaps, the biofuel additive to U.S. gasoline, rose 2.14% for the month, while coal for delivery in Rotterdam, the Netherlands, fell 10.59% in April as heating demand declines during spring. Meanwhile, June U.S. natural gas futures prices fell 7.95% as natural gas entered the shoulder season, when heating and cooling demand is low and tends to weigh on prices. European natural gas prices fell on seasonal fundamentals. U.K. natural gas futures prices for June delivery moved 10.70% lower in April, while natural gas futures prices in the Netherlands for June delivery decreased by 9.33% for the month ending on April 30. However, prices were higher than in April 2025 as the situation in the Middle East continued to cause supply concerns.
Precious metals posted mixed results, while base metals rallied in April
Precious metal prices soared in 2025 and early 2026, but they ran out of upside steam in late January.
Gold, the leading precious metal, moved 1.05% lower in April. The volatile silver futures market led on the downside with a 1.92% decline. NYMEX palladium futures rose 3.08%, leading on the upside, while NYMEX platinum futures moved 1.24% higher.
Copper, the leading nonferrous metal, experienced a 5.56% gain in the nearby futures contract, while base metals turned in mixed results in April. LME aluminum three-month forwards edged marginally higher, LME three-month copper forwards rallied, LME nickel forwards were significantly higher, LME lead forwards moved to the upside, LME zinc prices rallied, and LME tin forwards also posted gains.
Grains were higher, softs were mixed, and lumber declined
As the growing season in the Northern Hemisphere gets underway, grain and oilseed markets face fertilizer shortages, as the Strait of Hormuz is a logistical chokepoint for this critical agricultural input. New crop November Soybean futures prices moved 1.34% higher, while new crop December corn futures rallied 2.07%, and September CBOT soft red winter wheat futures moved 2.12% higher. Since Russia and Ukraine are major wheat producers, the ongoing war has driven up wheat prices, but fertilizer prices and supplies likely provided the most support for grain and oilseed prices in April.
Higher interest rates weighed on physical lumber futures in April, pushing the July futures contract 6.30% lower.
With the 2026 peak grilling season only one month away, live and feeder cattle futures rose 4.41% and 2.50%, respectively, in April. Meanwhile, the lean hog futures fell 2.64% for the month.
As May futures rolled to July, soft commodities posted mixed results in April, with cocoa and world sugar futures moving 6.00% higher and 6.82% lower, respectively. Cotton, which had been a laggard, posted a 13.96% monthly gain, leading the soft commodities sector on the upside in April. Arabica coffee futures fell 1.81%. The volatile FCOJ futures edged only 0.24% higher in April.
Spotlight on energy, but the 2026 grilling season begins in late May
Energy commodities were the focal point in April, as markets across all assets followed the oil market, which remained in the crosshairs of the Middle East conflict.
Any escalation in May could send crude oil prices soaring, which would be bullish for the energy sector. However, an end to the hostilities or a clear victory over the theocracy could send prices substantially lower. In April, the UAE announced it would leave the international oil cartel on May 1, which means that OPEC’s pricing power is deteriorating.
Cattle prices remain elevated as the animal protein moves towards the 2026 peak grilling season.
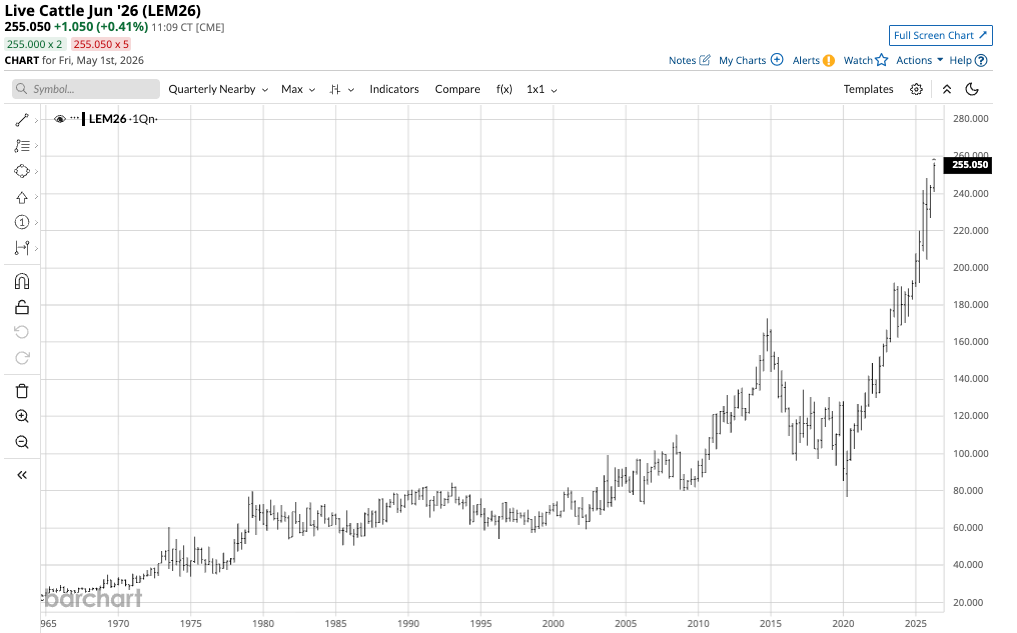
The quarterly continuous contract live cattle futures chart shows that live cattle futures are trading at record higher, and the bull market that began in 2020 remains firmly intact going into the 2026 grilling season.
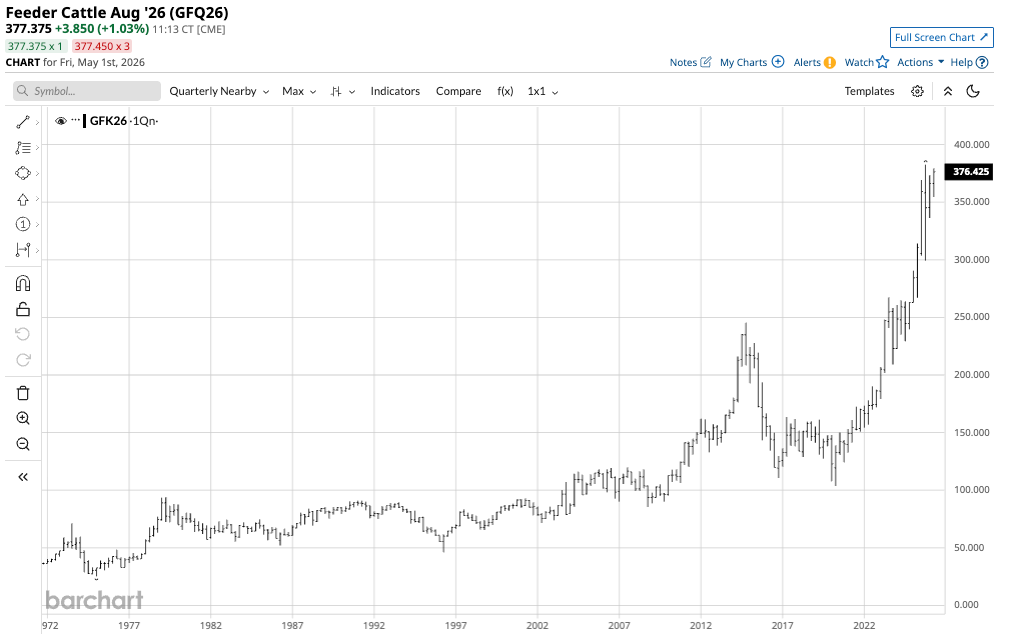
The quarterly continuous contract feeder cattle futures chart shows that the feeders are not far below, and within striking distance of the Q4 2025 record high, and the bull market that began in 2020 remains firmly intact going into the 2026 grilling season.
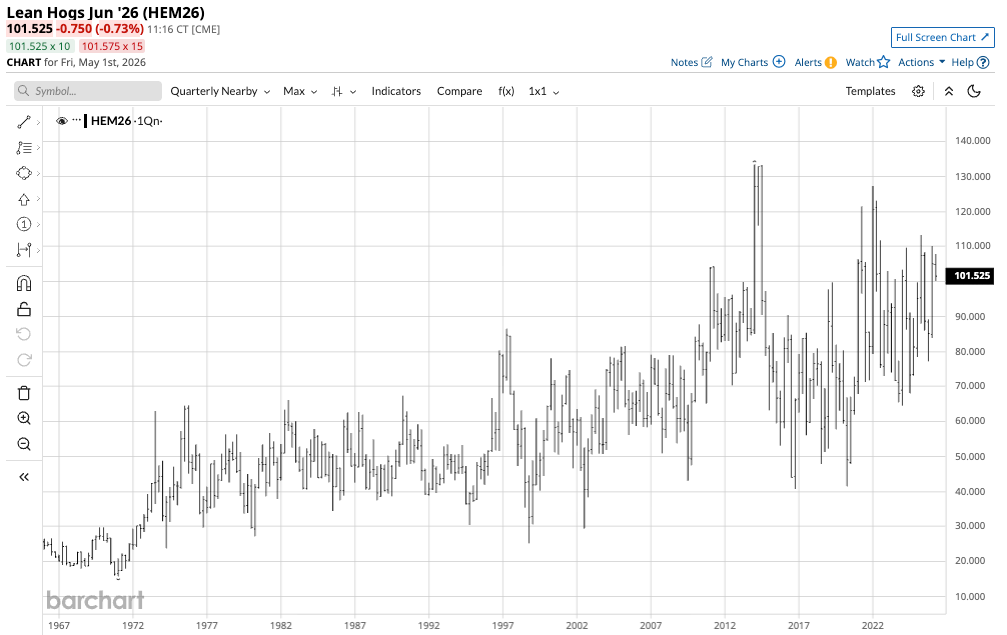
The quarterly continuous contract lean hog futures chart shows that while the pork futures are substantially below their record highs, the long-term price action has a bullish bias, reflecting rising production costs and inflationary pressures.
The 2026 peak grilling season begins on the Memorial Day weekend at the end of May and runs through the Labor Day weekend in early September. Meat prices tend to peak annually during the grilling season. While cattle futures have been in a bull market for years, hogs remain more sensitive to seasonal factors.
Factors to watch in May 2026
As commodities move into May, they face significant events in the economic and geopolitical landscapes. Seasonality favors some strength in grains, meats, and gasoline. The situation in the Middle East will continue to dictate the path of least resistance for energy and other commodity prices. The 2026 grilling season is less than one month away, which will likely support beef and pork prices. A meeting between the U.S. and Chinese presidents in the coming weeks could affect trade and geopolitical dynamics, which in turn affect commodity flows and prices.
Keep a close eye on those metals, as gold, silver, and copper remain in long-term bullish trends and could be showing signs of a bottom. The continued decline in fiat currencies’ purchasing power remains a factor supporting metals and all commodities.
The bull market in stocks continues, but the economic and geopolitical landscapes will determine the path of least resistance for U.S. stocks. Bonds have not broken out of their long-term consolidation pattern, but interest rates remain elevated, and the odds of a lower Fed Funds Rate under Kevin Warsh, the new Fed Chairman, could decline as oil prices remain elevated. High oil prices increase inflationary pressures, derailing rate cuts over the coming months.
Expect continued volatility in the commodities asset class in May 2026 and beyond, and you will not be surprised or disappointed.
On the date of publication, Andrew Hecht did not have (either directly or indirectly) positions in any of the securities mentioned in this article. All information and data in this article is solely for informational purposes. For more information please view the Barchart Disclosure Policy here.
/An%20Intel%20sign%20out%20front%20of%20a%20corporate%20office%20by%20wolterke%20via%20Adobe%20Stock.jpeg)
/Micron%20Technology%20Inc_%20logo%20on%20building-by%20vzphotos%20vis%20iStock.jpg)


/United%20Parcel%20Service%2C%20Inc_%20logo%20on%20truck-by%20100pk%20via%20iStock.jpg)