
March 2023, I wrote an article for Barchart, "Corn: Is the News Correlated to Price Movement?" I commented, "What is fascinating about this price break is the timing. The month of March typically experiences this price decline as it prepares for an April price rally. The rally typically culminates in June or July as a seasonal high, allowing the producers of corn to sell into this rally to hedge their recently planted crops for the 2023 crop season."
Corn futures for July delivery have rallied 8.5% from the March lows. Part of this rally is technical, which we will discuss soon, and part of it is fundamentals. Since March, traders have been paying attention to exports, which showed China buying US corn. The problems in the Ukraine region were intensified when Russia threatened not to renew the grain deal. And China, along with other countries, is trying to drive down the US Dollar's value as they try to create its petro-currency.
After the last two years of high corn prices, corn producers are flush with cash. Leading to less corn being brought to market as they await higher prices to sell into. Further intensifying the shortage of corn on hand, grain elevators have had to deal with a multi-year backwardation in corn prices where near-month prices are higher than further out months. There is no incentive to store grains in this market environment, and corn has been sold from elevators almost as quickly as they receive it, reducing current inventory levels.
What will it take for producers to bring old-crop corn to the market? Remember that producers are extremely busy preparing for the new crop planting season in the upcoming months. Flush with cash and busy preparing for the new crop is little incentive for selling now.
But, as any successful business knows, higher prices will bring that incentive to begin selling the old crop to make room in their bins for the new crop coming in the Fall. Additionally, the new crop must be hedged, and the higher prices will undoubtedly facilitate that opportunity.
Seasonal Pattern
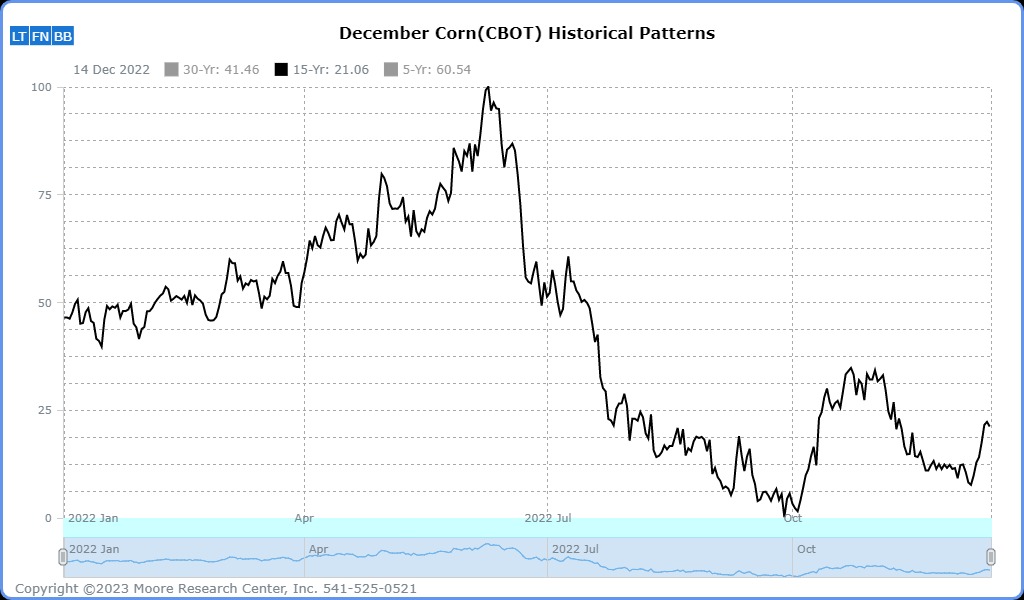
Source: Moore Research Center, Inc. (MRCI)
Moore Research Center, Inc (MRCI) research uses historical price analysis to determine which months of a calendar year may demonstrate a repetitive seasonal pattern of reversing prices or resuming solid trends.
April to June historically have seen higher prices as the market is trying to entice the producer to bring more corn to the market to meet nearby months' demand for corn. Concurrently, producers can hedge new crops once they know their total acreage planted.
Late May to the latter of June seasonally sees the highest prices for corn that year. As traders participate in this uptrend, don't get too complacent and think this trend will keep going to new all-time highs. The following chart illustrates how corn has made its seasonal highs in May or June since making all-time highs in 2012. 2012 was an exception, and prices peaked in August due to the worst drought in the past 50 years. Even the best seasonal pattern will fail during those extreme conditions.
As this current uptrend ages, review this chart and see that significant overhead supply will come to the market if prices approach or trade in the vicinity of all-time highs.

The Commitment of Traders (COT) Report

From the movie Bull Durham, "If you build it, they will come," we can see that as prices declined in March, the commercial traders (red) were scaling into the move with long positions. As the prices fell, managed money (blue) sold corn contracts and reduced their long position. Once the commercials absorbed the supply (built a base to rally from) in the corn market, prices stabilized and increased slowly. This did not go unnoticed by the trend-following managed money traders, and soon they did come and were buying this newly formed uptrend.
The price move down in March reduced the number of long positions held by managed money, and now they can begin buying even more contracts as the trend resumes higher.
Summary
Both a standard and a mini-size contract are available for trading futures. The standard size symbol is (ZC), and the mini-size is (XN). There is an Exchange-Traded Fund (ETF) symbol (CORN) for equity traders. Options are available on the standard-size futures contract and the CORN ETF. Before trading options, futures, or equities, seeking training first is recommended.
The seasonality of corn prices should be observed during the two pivotal times of the year: the planting and harvest seasons. I'm a trend follower and won't trade counter-trend setups. But, I remember in 2012 how many producers removed hedges and had the vision of ten-dollar corn. This can happen to even the most knowledgeable in the industry when they use emotions to make decisions.
Don't be a lemming and follow others off the pier by listening to the news as we approach the seasonal high period for corn. No doubt, the news will be very bullish.
More Stock Market News from Barchart
- Stocks Close Slightly Higher Despite Bank Stock Weakness and Hawkish Fed Comments
- Unusual Options Volume for Six Flags (SIX) Presents an Enticing But Risky Trade
- Netflix Puts Are Attracting Short Sellers Ahead of Its Earnings Out Today
- Analysts Remain Optimistic about a Recovery in Semiconductor Chip Demand
On the date of publication, Don Dawson did not have (either directly or indirectly) positions in any of the securities mentioned in this article. All information and data in this article is solely for informational purposes. For more information please view the Barchart Disclosure Policy here.
/Microsoft%20headquarters%20By%20Peter.jpeg)
/NVIDIA%20Corp%20logo%20outside%20building-by%20BING-JHEN_HONG%20via%20iStock.jpg)
/Micron%20Technology%20Inc_%20logo%20on%20building-by%20vzphotos%20vis%20iStock.jpg)
/Amazon%20-%20Image%20by%20bluestork%20via%20Shutterstock.jpg)