
February 2023, I wrote an article for Barchart, "While Corn Hibernates, Let's Visit Brazil," I posted, "MRCIs research confirms that February has historically been a slow to sideways month for cash corn prices. The volatility improves in March as the corn market prepares for its last seasonal rally into the spring planting season, where commercial producers will aggressively begin to sell futures for hedging purposes."

During this anticipated seasonal price decline, the news about corn was bearish for prices. Talks of US exports declining to low weekly levels due to China not being back to total capacity, the strong US Dollar, supply chain issues, etc.
What is fascinating about this price break is the timing. The month of March typically experiences this price decline as it prepares for an April price rally. The rally typically culminates in June or July as a seasonal high, allowing the producers of corn to sell into this rally to hedge their recently planted crops for the 2023 crop season.
Price action like this is expected in the markets. A popular quote from the former trading pits in Chicago was, "Prices need to break to rally, and rally to break." Market patterns like this allow trends to go longer as participants can scale into positions as the market declines and then scale out (sell pieces of their position) as the market moves higher. The selling offers new longs opportunities to enter the uptrend.
Now that the market has dropped significantly, the news is sounding different as the market now needs a catalyst to move prices higher for hedging purposes.
Weather is not a significant factor over the next several weeks. The world's largest producer of corn, the US, begins planting when the ground thaws from the cold winter weather, usually in April or May. Most of Brazil's second harvest, known as "Safrinha," Portuguese for "little harvest," is planted, and the critical pollination period is later in the season. Going further south, Argentina's crops are nearing harvest and almost out of the inclement weather damage window.
Since the weather is not the significant catalyst at the moment, don't discount its effects on the market later in the year, the next big event will be corn exports and ethanol production.
As Alan Brugler, a Barchart contributor, recently reported, "USDA announced another export sale of 667,000 MT of corn to China for 22/23 delivery this morning. If you couple the sales this week, it would be the largest sale, at least on a weekly basis, to China since May 2021."
China is a savvy dealer in the grain markets. They are known for posting these offers and then canceling them, causing significant price swings in the commodity due to the size of their tenders. But, the initial news of their tenders is always bullish, and the markets react to them.
Alan went on to report about the other elephant in the room for corn, ethanol production, "The weekly EIA report indicated a 4,000 barrel per day increase in ethanol production for the week that ended on 3/17 to 1.014 million bpd."
Information regarding corn exports and ethanol production is becoming more bullish after this recent precipitous corn selloff. Bullish news will begin to bring in more buyers of corn. And soon, the final seasonal rally into the post-planting season.
As traders, it's vital to decipher whether the news is being used to move prices to another area on the chart to build a significant counter position or if the information genuinely supports the current price trend. For this reason, many traders combine fundamental knowledge with technical analysis to better understand how the news is leaning.
Seasonal Pattern
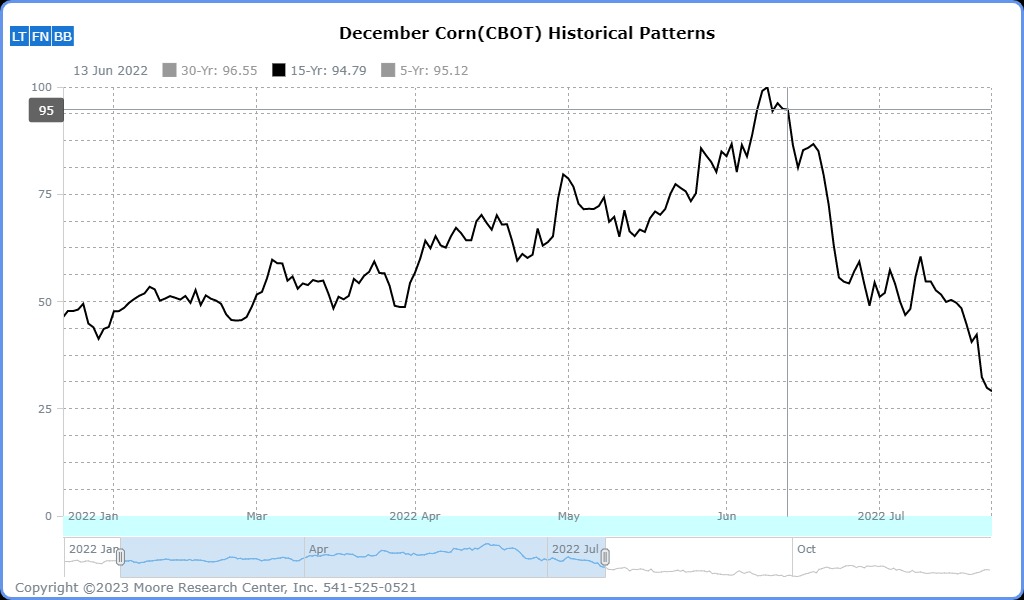
Moore Research Center, Inc (MRCI) research uses historical price analysis to determine which months of a calendar year may demonstrate a repetitive seasonal pattern of reversing prices or resuming solid trends.
From my previous article, we can see that February is typically a sideways price action month. Meanwhile, March sees selling pressure and rebounds strongly toward the end of the month to begin the April to June rally to allow hedgers to sell futures at higher prices.
We can review the COT report to enhance this seasonal pattern and see if the commercials are interested in being long corn in preparation for the anticipated price rally.
The Commitment of Traders (COT) Report

The above chart from Barchart.com illustrates the disaggregated COT report with 2 of the 4 reporting groups. The primary participants in the futures markets are commercial (red) entities and managed money (blue) speculators. The commercial is in the market to hedge price risk associated with using the physical commodity and managed money to speculate in search of capital appreciation.
The goal of the commercial entities is to use the trend following money managers' positions to push prices to where commercials need to buy and sell products. During the late Spring period, the producers will want to sell at higher prices and will certainly not be discussing bearish news at this time. If anything, they can convince the trend followers that there are issues impacting the supply of corn and attempt to create a speculator rally.
The COT report has been delayed recently due to the internet hack on a large trading firm. Shortly, the COT report will be back on its weekly reporting schedule.
A bullish commercial posture during a seasonal buying period is typically the beginning of an uptrend. As of the last reporting period, we can see that the commercial processors (red) have been buying corn to the extent of being the least bearish in 52 weeks. At the same time, managed money has their smallest long position in the past 52 weeks.
Technical View

As we view this weekly corn chart, there are already signs of buying appearing after the recent selloff. As the commercials were buying and prices declined, they absorbed the overhead supply. Once the commercials absorb the supply, the price will gradually grind higher. The managed money trend following systems will begin buying and completing the commercials' goal of a price rally into the post-planting season.
The red line on the chart represents a significant location that may prove the rally has begun if the price can trade above. But, until the market can do this, there will still be supply overhead, and bullish traders should be careful.
Summary
Both a standard and a mini-size contract are available for trading futures. The standard size symbol is (ZC), and the mini-size is (XN). There is an Exchange-Traded Fund (ETF) symbol (CORN) for equity traders. Options are available on the standard-size futures contract and the CORN ETF. Before trading options, futures, or equities, seeking training first is recommended.
Grain market seasonal patterns are relatively consistent. Traders should never blindly buy or sell based solely on a seasonal pattern. But, when a trader can add confirmation that the seasonal pattern may work, an edge has been created for a trade. As traders know, we can still have losing trades even with an advantage. Proceed with caution for all of your speculative decisions.
More Stock Market News from Barchart
- Stocks Surge on Rescue Plan for First Republic Bank
- U.S. Demands ByteDance Sell TikTok
- Stocks Rally as Lower Bond Yields Offset Weakness in Bank Stocks
- A Closer Look at Michael Burry’s Thoughts on the Banking Sector
On the date of publication, Don Dawson did not have (either directly or indirectly) positions in any of the securities mentioned in this article. All information and data in this article is solely for informational purposes. For more information please view the Barchart Disclosure Policy here.
/Space/Planet%20earth%20with%20flying%20rocket%20by%20Sergey%20Mironov%20via%20Shutterstock.jpg)

/Robinhood%20app%20on%20phone%20by%20Andrew%20Neel%20via%20Unsplash.jpg)
/Alphabet%20(Google)%20Image%20by%20Markus%20Mainka%20via%20Shutterstock.jpg)
