
Natural gas is a seasonal commodity that typically reaches annual highs during the coldest winter months, when heating demand peaks. In my January 15, 2026, Barchart report on energy commodities in Q4 and 2025, I wrote the following on the prospects of NYMEX natural gas futures prices in early 2026:
Natural gas and coal prices should remain volatile through the winter as demand will depend on weather conditions.
Nearby NYMEX natural gas prices settled at $3.686 per MMBtu on December 31, 2025, and were lower at the $3.334 level on January 12. Cold weather across the United States pushed prices for February delivery to $7.827 per MMBtu during the week of January 26, where they ran out of upside steam and fell to far less than half that price in early February.
Cold weather lit a bullish fuse that caused prices to more than double and more than half in value
The weekly continuous U.S. natural gas chart for March delivery highlights the extreme price volatility caused by cold weather across the country over the past weeks.
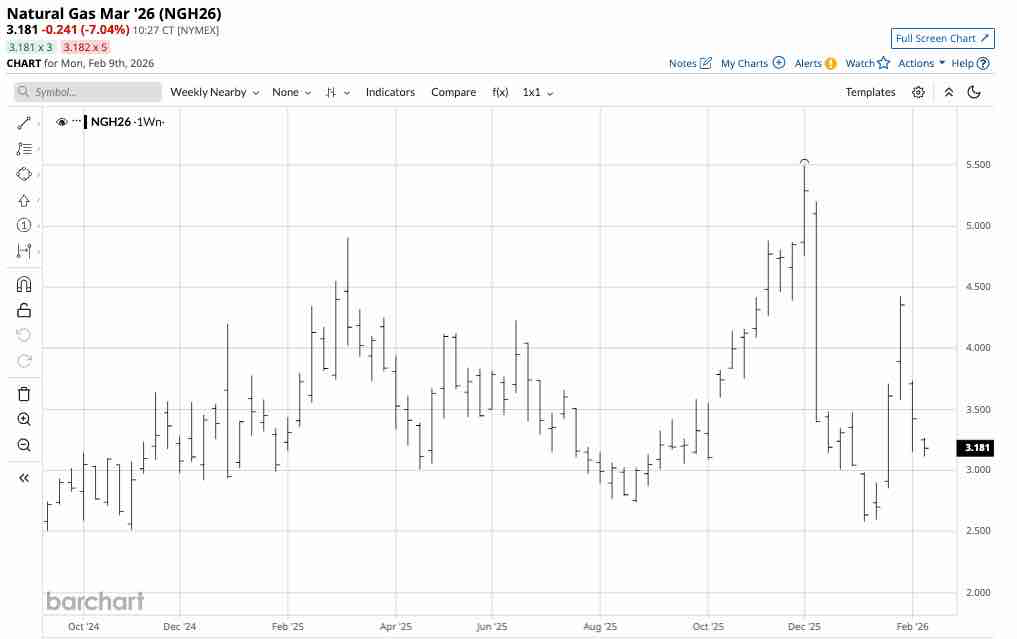
The chart shows that natural gas for March delivery reached a high of $5.496 in early December 2025 before plunging 53% to a low of $2.578 in early January 2026. The cold conditions and snowstorms increased heating demand in late January, lifting the price 71.6% to a high of $4.425 per MMBtu before it slipped back to below $3.20 on February 9.
Seasonality is bearish during the shoulder months
While the March continuous futures contract rose to just below $5.50 per MMBtu, the now-expired February NYMEX natural gas futures contract reached $7.827 per MMBtu, the highest price since September 2022.
Over the coming weeks, temperatures are likely to rise, ushering in the U.S. natural gas shoulder season in spring, when demand for heating and cooling reaches an annual low. Barring any widespread cold periods, we could see natural gas prices fall to $3 per MMBtu or lower. However, with at least six weeks of winter left, the potential for periodic rallies remains high.
Inventories are now slightly lower than the five-year average
According to the EIA, natural gas stockpiles declined 360 billion cubic feet for the week ending on January 30, 2026.
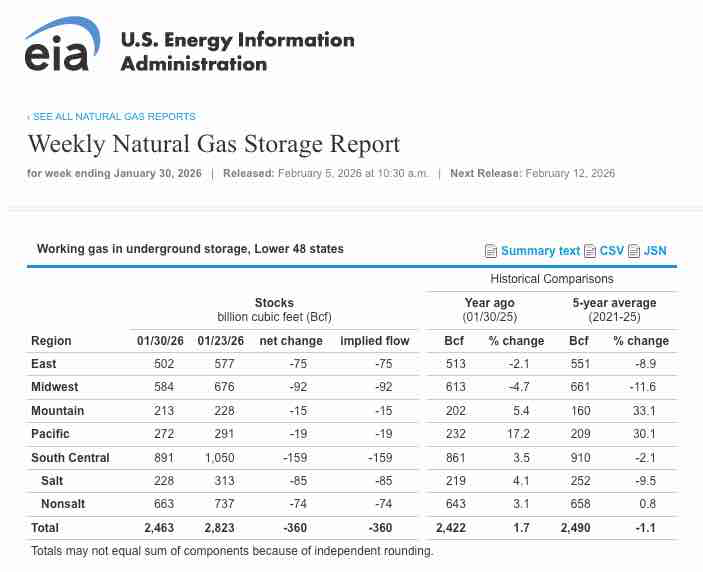
As the chart shows, at 2.463 trillion cubic feet, U.S. natural gas stockpiles are only 1.7% above last year’s level but are 1.1% below the five-year average for the end of January. The EIA will report natural gas stocks for the week ending on February 6 on Thursday, February 12. According to estimize.com, the consensus forecast is for another substantial withdrawal of 256 billion cubic feet due to ongoing heating demand with freezing temperatures on the East Coast and Midwest.
Trading natural gas is optimal
Given the extreme volatility, U.S. natural gas futures are not for the faint of heart. However, substantial percentage rallies and price plunges create an optimal environment for nimble, flexible traders with their fingers on the pulse of the energy commodity. The most direct route for risk positions in natural gas is the futures and futures options on the CME’s NYMEX division.
Each U.S. NYMEX natural gas futures contract contains 10,000 MMBtus. At $3.20 per MMBtu, the contract value is $32,000. The NYMEX original margin requirement of $5,602 per contract means that a market participant can control $35,000 worth of natural gas with a 17.5% downpayment. If equity drops below $5,093, the exchange requires maintenance margin payments. Futures are highly leveraged, only magnifying the risk of trading natural gas futures.
BOIL and KOLD magnify short-term natural gas futures price action
The U.S. Natural Gas Fund (UNG) is a non-leveraged ETF that tracks U.S. NYMEX natural gas prices. At $12.30 per share, UNG had over $402.7 million in assets under management. UNG trades an average of over 29.22 million shares per day and charges a 1.11% management fee. March natural gas prices fell 53% from early December through early January before rising 71.6% in late January.
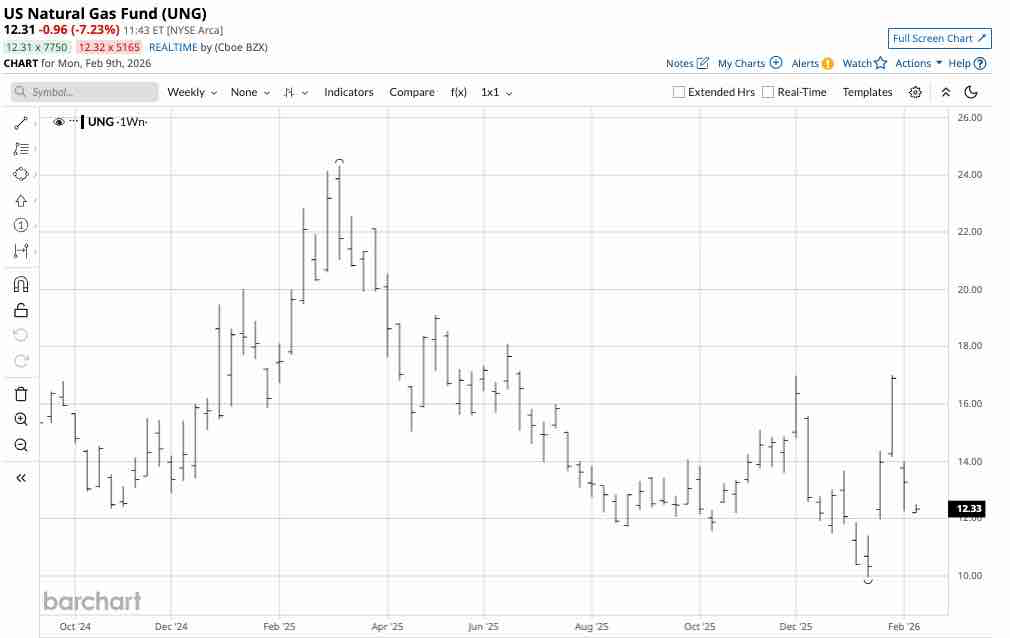
The weekly chart shows that over the same period, the UNG ETF fell 41.5% from $17.00 to $9.95 and rose 71% to $17.02. UNG does a good job tracking nearby NYMEX natural gas prices. The Ultra Bloomberg Natural Gas 2X ETF (BOIL) and the Ultrashort Bloomberg Natural Gas -2X ETF (KOLD) magnify UNG’s and natural gas’s price action on the up and downside, respectively.
At $19.09 per share, BOIL had over $224.24 million in assets under management. BOIL trades an average of over 19 million shares per day and charges a 0.95% management fee.
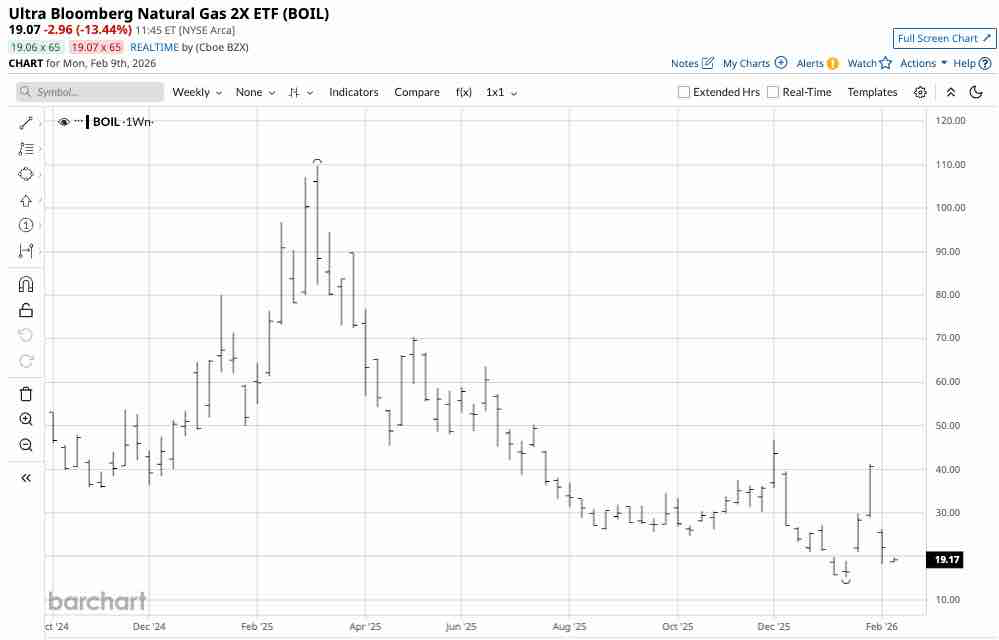
As the chart shows, the bullish BOIL ETF fell 67.6% from $46.85 to $15.20 per share from early December through early January before rising 171.4% to $41.25 per share in late January.
At $20.66 per share, KOLD had over $545.62 million in assets under management. KOLD trades an average of over 19.1 million shares per day and charges a 0.95% management fee.
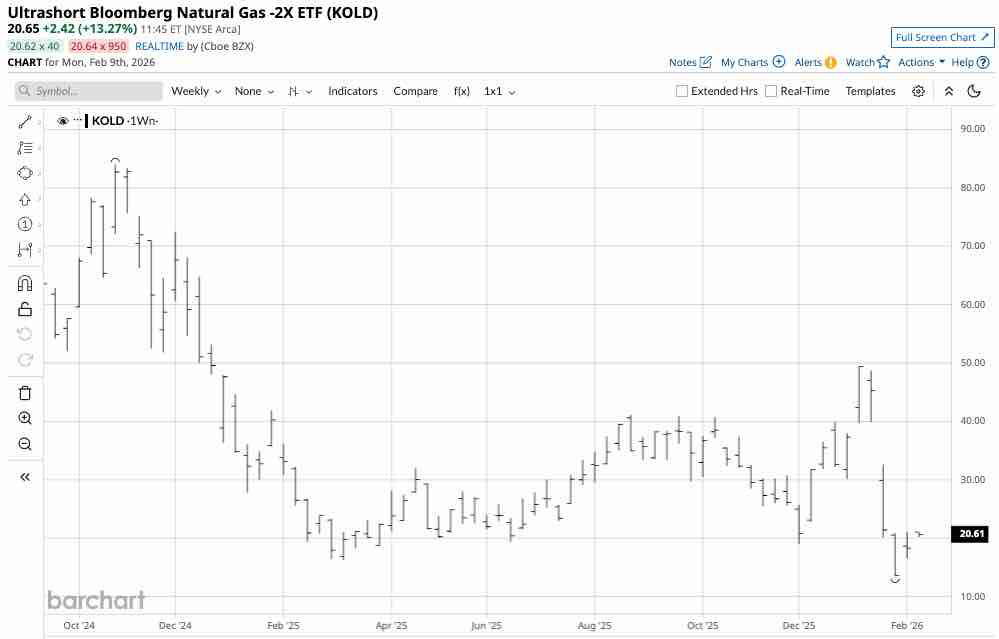
As the chart shows, the bearish KOLD ETF rose 160.4% from $19.00 to $49.47 per share from early December through early January, then fell 72.8% to $13.44 per share in late January.
Natural gas is already a volatile commodity, and while the UNG ETF does an excellent job of tracking U.S. futures prices, BOIL and KOLD are leveraged vehicles that magnify price action on the upside and downside, respectively. Natural gas is a trading market, and given its penchant for extreme volatility, passive investors should stay away. When approaching natural gas with the leveraged BOIL and KOLD ETFs, price and time stops are critical, as time decay is the price for the leverage.
I expect volatile conditions to continue over the coming weeks, as natural gas prices will be as fickle as the weather. However, the odds favor the downside in March and April, as the shoulder season begins and typically leads to a decline in demand.
On the date of publication, Andrew Hecht did not have (either directly or indirectly) positions in any of the securities mentioned in this article. All information and data in this article is solely for informational purposes. For more information please view the Barchart Disclosure Policy here.

/Nvidia%20logo%20by%20Konstantin%20Savusia%20via%20Shutterstock.jpg)

/Apple%20products%20on%20desk%20by%20Ake%20Ngiamsanguan%20via%20iStock.jpg)
/McDonald's%20Corp%20arches%20by-%20TonyBaggett%20via%20iStock.jpg)