
You’ve heard of a Rorschach test, right? The one where you’re shown a series of inkblot images – and your answers are used as a psychological analysis tool? Well today, it’s time for your TECH sector test!
Here’s my MoneyShow Chart of the Day — a nine-month chart of the Invesco QQQ Trust (QQQ). Do you think it’s bullish? Or bearish?
(To get more articles and podcasts from MoneyShow, subscribe to our Top Pros’ Top Picks newsletter here.)
Invesco QQQ Trust (QQQ)
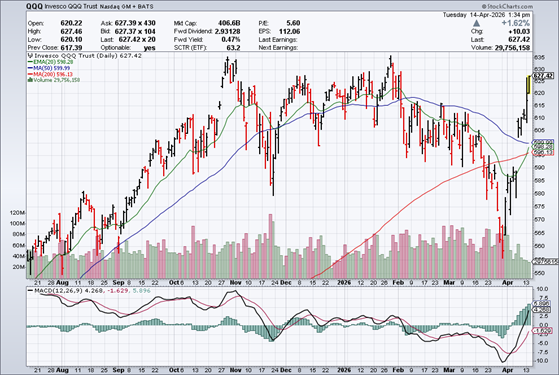
Source: StockCharts
If you’re a bull, you’ll probably point to the recent 10-day winning streak and the fact the QQQs are back to roughly breakeven on the year. If you’re a bear, you’ll probably highlight how the QQQs have gone nowhere since November, and that we’ve been rallying on steadily falling volume.
I didn’t show the charts here. But bulls could also point to the fact the iShares Russell 2000 ETF (IWM) is near its old highs...while bears could say the Invesco S&P 500 Equal Weight ETF (RSP) and SPDR Dow Jones Industrial Average ETF (DIA) remain well below their pre-war peaks.
So, what do you see? Something to get excited about? Or a market that still hasn’t proved itself?
Make sure you can answer that question to your OWN satisfaction before committing more capital here. From where I sit though, it looks like the jury is still out.

/A%20Palantir%20office%20building%20in%20Tokyo_%20Image%20by%20Hiroshi-Mori-Stock%20via%20Shutterstock_.jpg)

/A%20close-up%20of%20a%20SpaceX%20sign%20by%20Sundry%20Photography%20via%20Adobe%20Stock.jpeg)
/Corning%20Incorporated%20on%20screen%20in%20front%20of%20website%20By%20Timon.jpeg)