- Early Tuesday morning, the IEA projected global oil demand to fall by 80,000 barrels per day during 2026.
- This raises the question of a potential bearish demand market, as opposed to a bullish demand market defined by new demand on steady to growing supplies.
- Forward curves and spread tables indicate this is not the case, but rather increased volatility created by the US president's War on Iran.
One of the first market headlines that jumped out at me Tuesday morning came from CNBC and read, “Oil falls as IEA (International Energy Agency) predicts ‘demand destruction’ will spread and hopes for fresh Iran talks grow”. Since this story came out pre-dawn, we’ve seen both Brent (QAM26) and WTI (CLK26) crude oil continue to slide, a move that began during Monday’s session in what looked to be what has come to be known at the latest TACO Trade. In other words, there was a good chance the US president was going to back away from his threat of blockading the Strait of Hormuz and announce yet another ‘deal’ as the reason why. The game isn’t complicated, and the only one in town these days.
Aside from this silliness of the situation, something we can classify as a Lasagna Likeness (Market activity that repeats itself), Tuesday’s headline does raise an interesting discussion about key differences between supply-driven and demand-driven markets. There is an important distinction between these two types of markets: Supply-driven create short-term price changes while the end result of demand-driven situations are long-term changes to price expectations. A couple examples: Back in 2024 I wrote a piece discussing the short supply situation in cocoa created by adverse weather – the usual suspect in supply-driven markets is indeed Mother Nature – with the outlook being the market would fall again once the next harvest rolled around. The spot-month contract posted a high of $12,930 (per metric ton) during December 2024, only to fall to a low of $2,800 by the end of February 2026.
As for a demand-driven market, look no further than King Corn back in the mid-2000s. When the Energy Policy Act of 2005 was passed, the National Corn Index (national average cash price, intrinsic value of the market) rallied off a low of $1.54 October 2025 to an initial high of $3.98 at the end of February 2007, and eventually $6.74 (June 2028) and $7.97 (July 2012). The deepest post-ethanol boom selloff saw the Index ($CNCI) drop to a low of $2.74, still on top of the previous long-term range between roughly $1.50 and $2.50. Recently, the Index has dropped from a high of $8.00 (April 2022) to a low near $3.70 (August 2024).
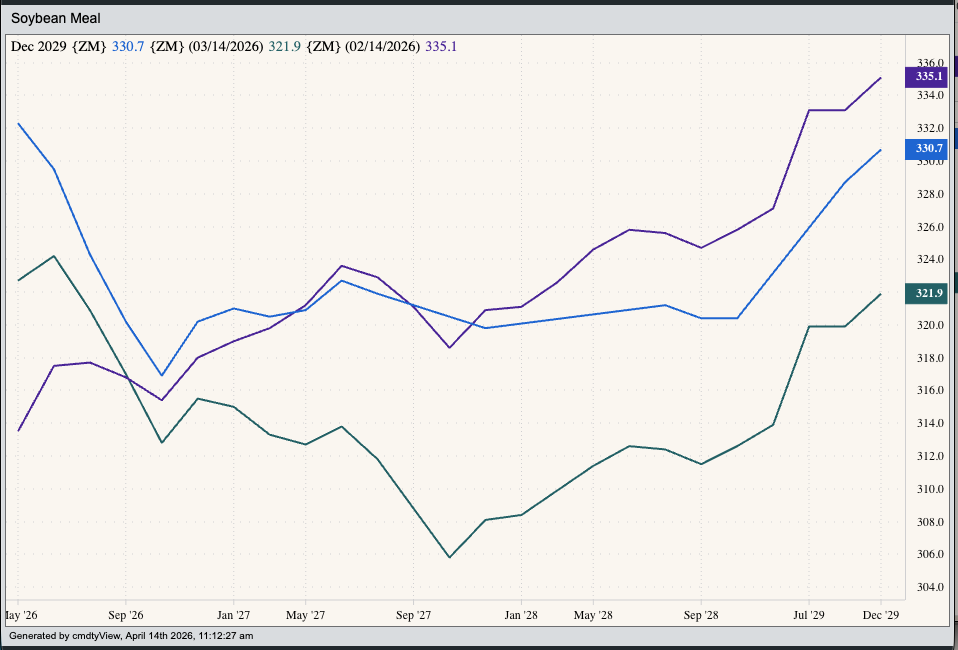
The first question is how to determine if a market is supply-driven or demand-driven? We can usually look at forward curves to give us a clue. (Note my use of the Vodka Vacuity: There are no Absolutes in markets.) If a rally is being driven by a short-term short supply scare, then the forward curve will look like a check mark, with the first few contracts in backwardation (inverted) with deferred issues returning to a contango (carry). Interestingly enough, I ran the traps of the various markets I watch and couldn’t find an example of the classic checkmark, with the closest I came up in soybean meal where the turn comes with the new-crop October futures contract (ZMV26).
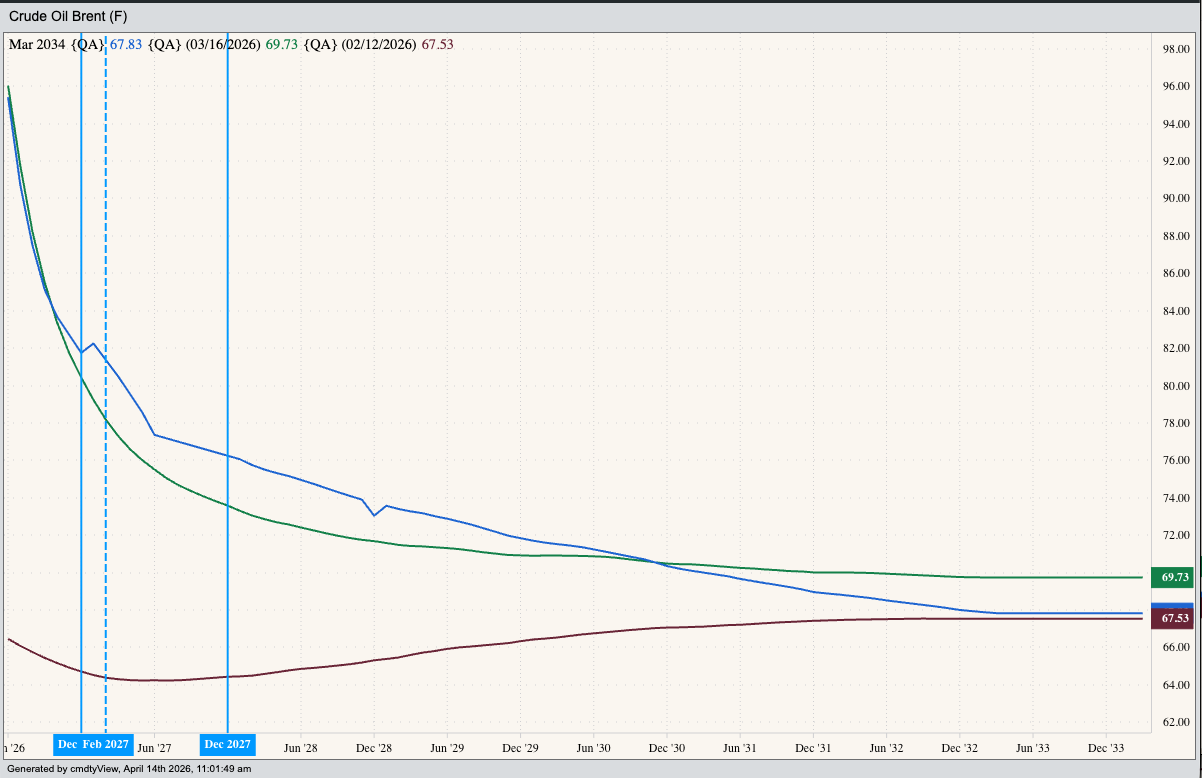
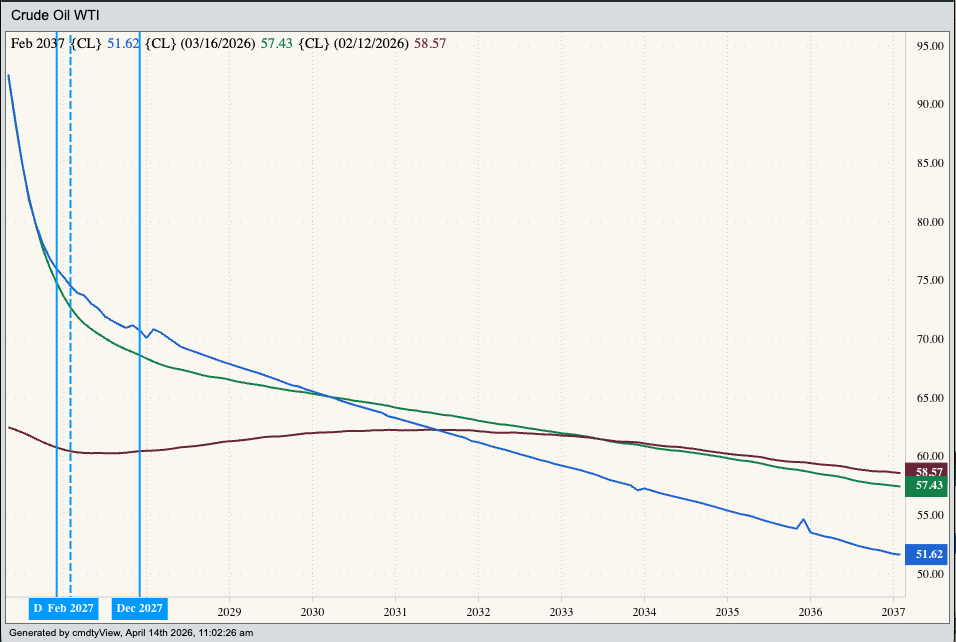
If a rallying market is demand-driven, it’s a bit more difficult. Initially, we tend to see a solid contango as far out we care to look. It’s interesting to note that forward curves for both the global Brent and US domestic WTI crude oil markets show a change from a short-supply scare to long-term demand gaining on available supplies. Back on February 12 the Brent curve was in backwardation from the June 2026 contract through the May 2027 issue, then showing a contango to infinity (and beyond). However, the latest curve shows backwardation starting with June 2026. The WTI curve is a bit more dramatic with the May 2026 issue priced near $92.50 and the May 2036 issue near $52.90.
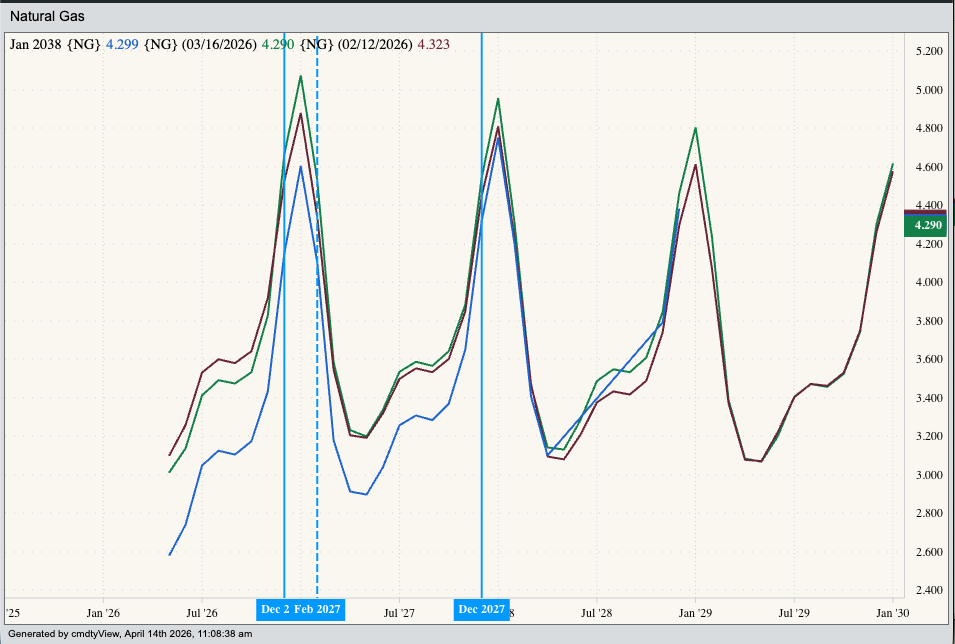
What would a bearish demand market show us, though? In other words, what would the forward curve look like if crude oil was actually staring into the abyss? My Blink reaction (based on the Malcolm Gladwell book Blink) is we would see a strengthening contango in the deferred contracts. A quick check across the Energies sector and I can’t find this anywhere. (I included the natural gas forward curve to again highlight my deep appreciation, and wonderment, for those who make a living trading the Widow Maker.) In other words, talk of ‘demand destruction’ seems to be just that – talk. The markets are not indicating such a situation, but markets can change, so we need to keep an eye on things.
On the date of publication, Darin Newsom did not have (either directly or indirectly) positions in any of the securities mentioned in this article. All information and data in this article is solely for informational purposes. For more information please view the Barchart Disclosure Policy here.
/Microsoft%20headquarters%20By%20Peter.jpeg)
/Micron%20Technology%20Inc_%20logo%20on%20building-by%20vzphotos%20vis%20iStock.jpg)
/NVIDIA%20Corp%20logo%20outside%20building-by%20BING-JHEN_HONG%20via%20iStock.jpg)
/Amazon%20-%20Image%20by%20bluestork%20via%20Shutterstock.jpg)