The price difference between Brent crude's spot price and nearby futures contract finished last week at $32, the strongest basis read since at least 2008.
Additionally, forward curves for both Brent and WTI show strengthening backwardations meaning commercial interests continue to push the markets to source supplies to meet demand.
It is impossible to guess how high crude oil could go, but when supplies start to move again, the selloff will be volatile.
Late last week I saw a story on CNBC.com with the teaser, “Brent oil spot price for actual cargo soars to $141, highest level since 2008 financial crisis”[i]. Three things jumped out at me about this. Let’s talk about them.
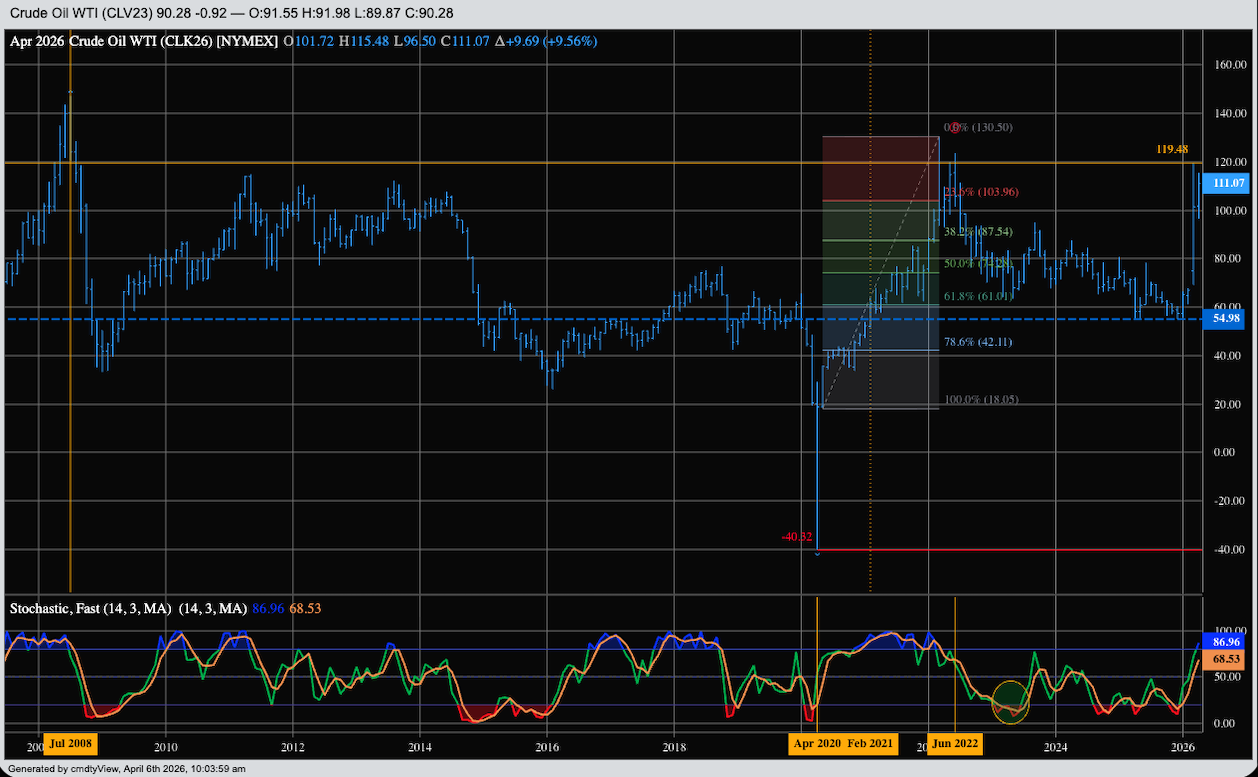
First, the 2008 financial. In my discussion with Michelle Rook last week, I mentioned the difference between what we are seeing in the crude oil market today versus what was going on back in 2008. Back then, I appeared on one of the CNBC programs, debating with New York energies trader about over the outlook for the US domestic WTI crude oil market. At the time the spot-month futures contract was in the $130 to $140 per barrel range, with much of the noise focusing on how soon until it rocketed beyond $150, maybe to $200. I didn’t see it that way, making the point the market’s forward curve was in a strengthening contango (carry for all of you not in New York) meaning fundamentals did not support an extension of the spike rally. This was in the summer of 2008. By the time we had reached the end of December 2008 the spot-month contract had fallen to $35 before extending its break to $33 in January 2009.
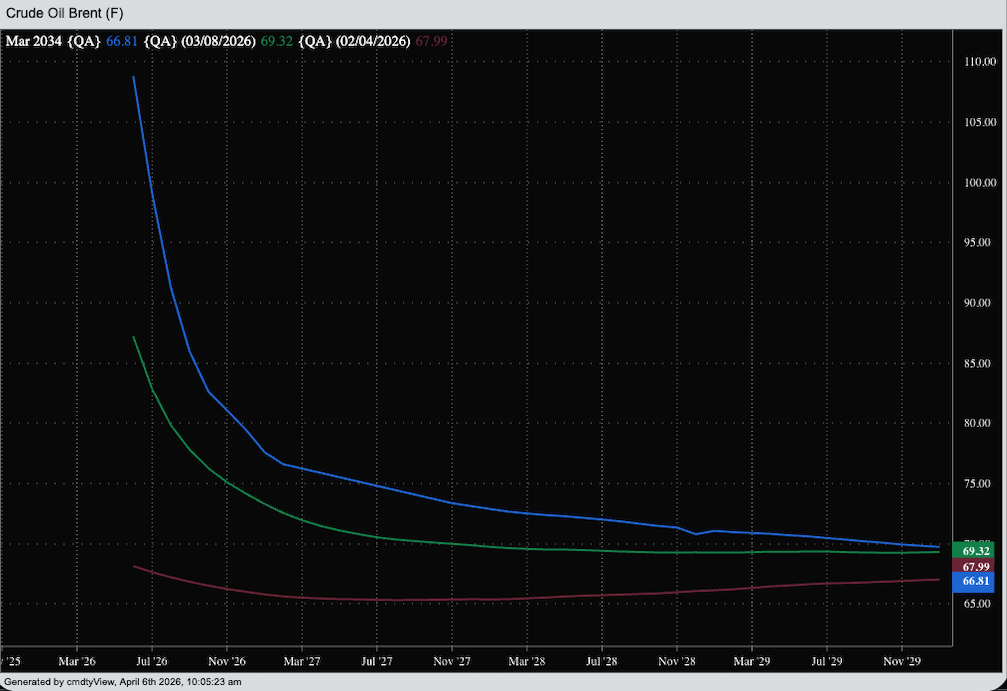
Second, this time around, though, the forward curves for both WTI and the global Brent crude markets are showing strong backwardation (inverses), meaning nearby futures contracts are higher priced than deferred issues. When talking about a storable commodity (e.g. Energies, Grains), a forward curve that is in backwardation tells us the market’s real fundamentals are bullish. Commercial interests are pushing the spot or nearby price in an attempt to source supplies to meet demand. Oddly enough, this also takes me back to 2008 when I traveled to New York to speak at a meeting of energy sector traders and investors in the shadow of the Brooklyn Bridge. One of the other speakers, another analyst, showed a scatter plot chart connecting the market’s contango (again, at the time) to actual supply and demand.
Third, you might recall that my reads on real market fundamentals do not come from a government agency, any government agency, but rather the market itself. My progression of reads is as follows: Spot/cash price, Basis, Futures Spreads/Forward Curves. Looking at last week’s crude oil market, Brent in particular, the spot price was reported at $141 as compared to the nearby June futures contract (QAM26) settlement last Thursday at $109. That meant basis was $32 over. Digging back through the archives, my son Ben found this to be the strongest basis has been going back through 2008. What about Russia’s invasion of Ukraine back in 2022? Brent basis jumped to $11 over. Back in 2008 basis was actually weak, as we would expect given it was a technical rally rather than one driven by fundamentals.
What does this level of strong basis tell us? Keep in mind basis, in any market, is the key fundamental tool we have. When basis collapses, like it did in 2008, we know a market bubble is forming as futures lose touch with reality. When basis strengthens beyond previous extremes we know there is a real issue with supply in relation to demand – something along the line of the Strait of Hormuz getting shutdown because of political and/or military folly. Michelle asked me how high I thought crude oil could go given basis and forward curves. I have no idea.
What I do know is this is not a demand driven market, but rather a short supply situation. What I mean by this is where the former is a long-term change in price expectations (e.g. the US ethanol boom back in the mid 2000s), the latter creates a shorter-term price spike that usually implodes with the arrival of the next round of supplies (see the weather driven rallies to record highs in the Softs sector over the last number of years). Since we have no idea how long the US president will continue his War on Iran, there is no way of telling how long this short supply situation could last. Keep in mind Russia’s invasion of Ukraine is into its fifth year.
[i] You can read the piece here: (LINK)
On the date of publication, Darin Newsom did not have (either directly or indirectly) positions in any of the securities mentioned in this article. All information and data in this article is solely for informational purposes. For more information please view the Barchart Disclosure Policy here.

/Renewable%20Energy%20by%20Yuri%20Hoya%20via%20Shutterstock.jpg)


/A%20close-up%20of%20a%20General%20Motors%20corporate%20sign%20by%20lindaparton%20via%20Adobe%20Stock.jpeg)