
I wrote an article for Barchart titled "Is Corn's Seasonal Low In?" I discussed how markets that bottom earlier than their usual seasonal lows tend to rally stronger and longer than average. The post-harvest low was created in August instead of the typical September or October timeframe.
Many factors are presenting themselves, leading to this potential resumption of the uptrend. Corn has corrected off the high of $8.24 per bushel, basis a continuous chart, down to $5.61 before finding support and rallying to current prices of $6.33 basis the March contract. The correction did not break the pattern of higher highs and higher lows on the weekly chart keeping the longer-term uptrend intact.
Corn's all-time high is $8.49 from August 2012, just .25 above the recent rally high. Will corn find the buyers to push prices to new all-time highs?
Specifications and statistics
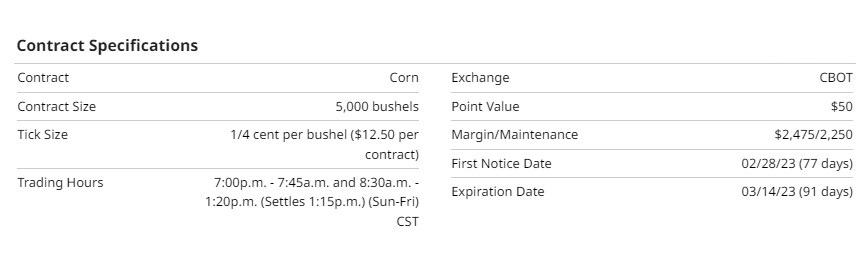
Corn is the largest crop in the U.S. in terms of dollar value and the number of acres planted. Corn is used primarily as livestock feed in the United States and the rest of the world. Other uses for corn are alcohol additives for gasoline, adhesives, corn oil for cooking and margarine, sweeteners, and as food for humans.
The largest futures market for corn is at the CME Group. Both a standard and a mini-size contract are available for trading. The standard size symbol is (ZC), and the mini-size is (XN). For equity traders, there is an Exchange-Traded Fund (ETF) symbol (CORN). Options are available on the standard-size futures contract and the CORN ETF. Before trading options, futures, or equities, seeking training first is recommended.
Recent Performance
For the prior three months, corn has a negative return of -6.25%. Year-to-date has double-digit returns of 18%. The harvest season contributed to the negative 3-month return due to the excess supply that came to the market.
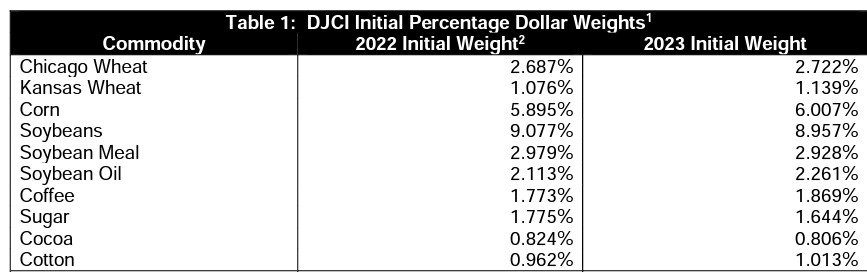
Source: S&P Dow Jones Commodity Index (Goldman Sachs Commodity Index) (GSCI)
The GSCI uses futures contracts instead of owning the physical products for managing the fund. The GSCI is always long these contracts. The GSCI is rebalanced each November for the following year's initial percentage weighting. Looking at the 2023 initial weights, we can see that the GSCI will increase their long corn futures positions by .112%, adding a more bullish sentiment to the corn market.
Technicals
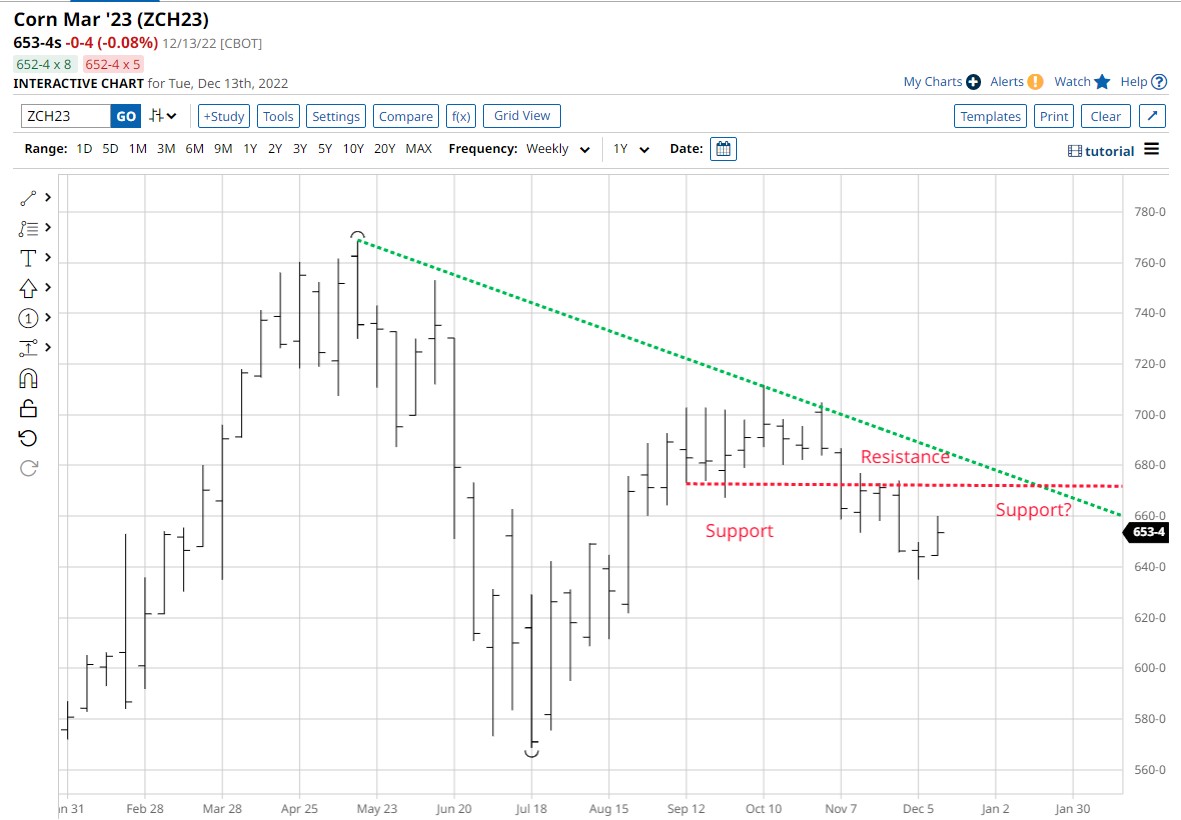
The weekly corn chart has some overhead resistance that the bulls must trade through before the uptrend can resume. The down-sloping (green) trendline starts at the high of the recent bull market and has three nearby touches making this a significant resistance point. The horizontal red line represents prior weekly support that has now become resistance after the price traded through the line. It would take a close back above both overhead resistance lines to confirm that the bulls have control of this market. Upon doing that, the horizontal red line would become support again. Returning to this area after breaking out to higher prices may offer a place for entering a long position.
Seasonality
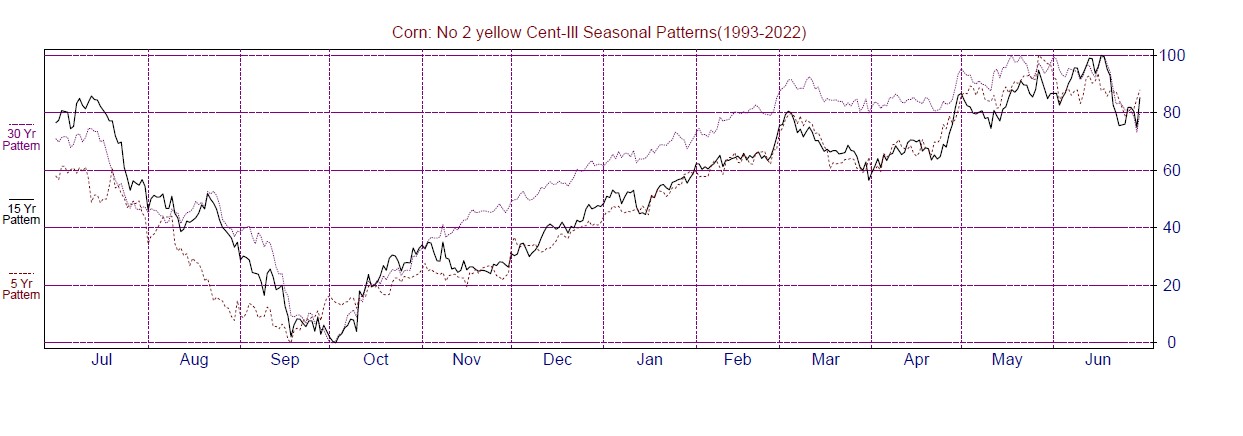
Source: Moore Research Center, Inc. (MRCI)
Corn appears to be continuing its post-harvest seasonal low rally. MRCIs graph shows the seasonal trend gains upward momentum into December and January.
Seasonal analysis should always include using other tools to make trading decisions. Especially with crops due to the many variables that could impact the supply chain. Combining analysis tools will give a trader a better edge in their market analysis.
The Commitment of Traders (COT) Report
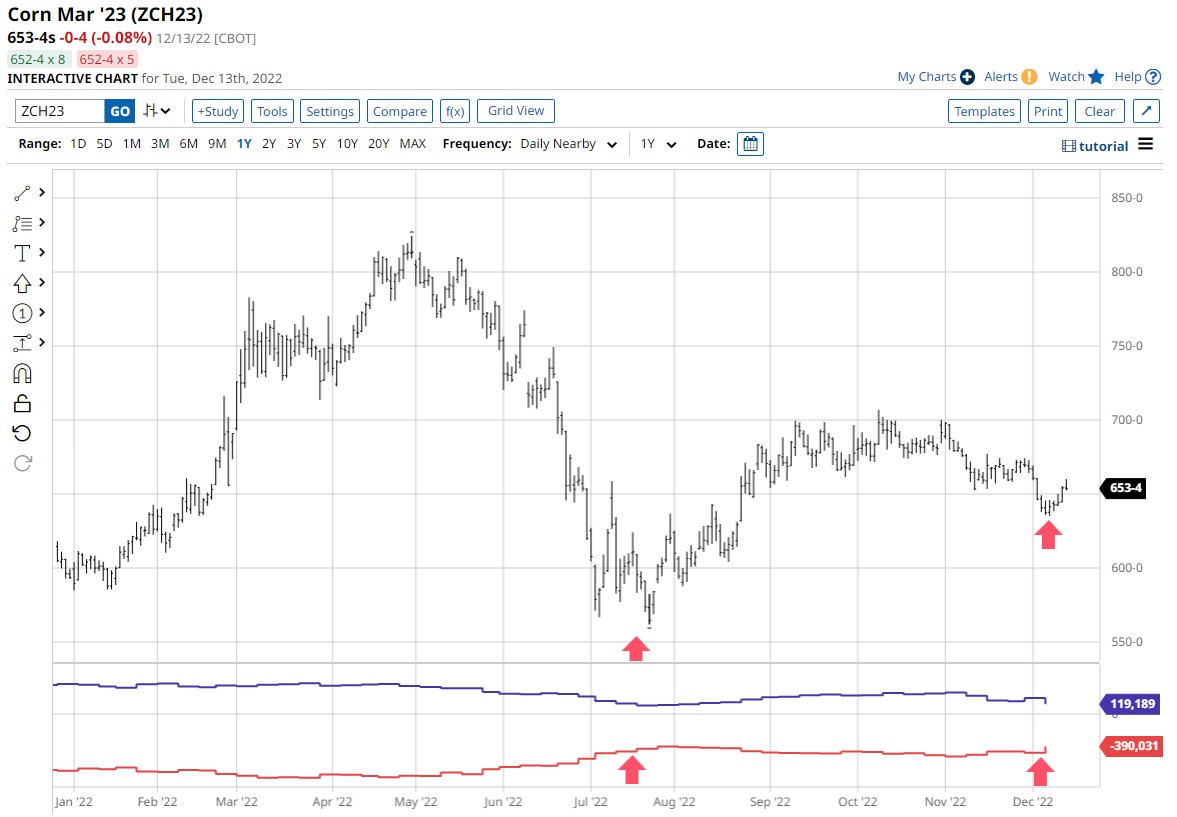
The COT report from Barchart shows corn with one year of data. Corn's seasonal low was created early this year, near August. The red arrows below the seasonal low indicate the commercial traders' bullish posture when they produced the seasonal low. During this period, they were more bullish than at any time in the past 12 months. Looking further right, the second group of arrows shows that the commercials have been buying more contracts and are as bullish as they were at the seasonal lows. The difference this time is that they are buying at higher prices. Bullish?
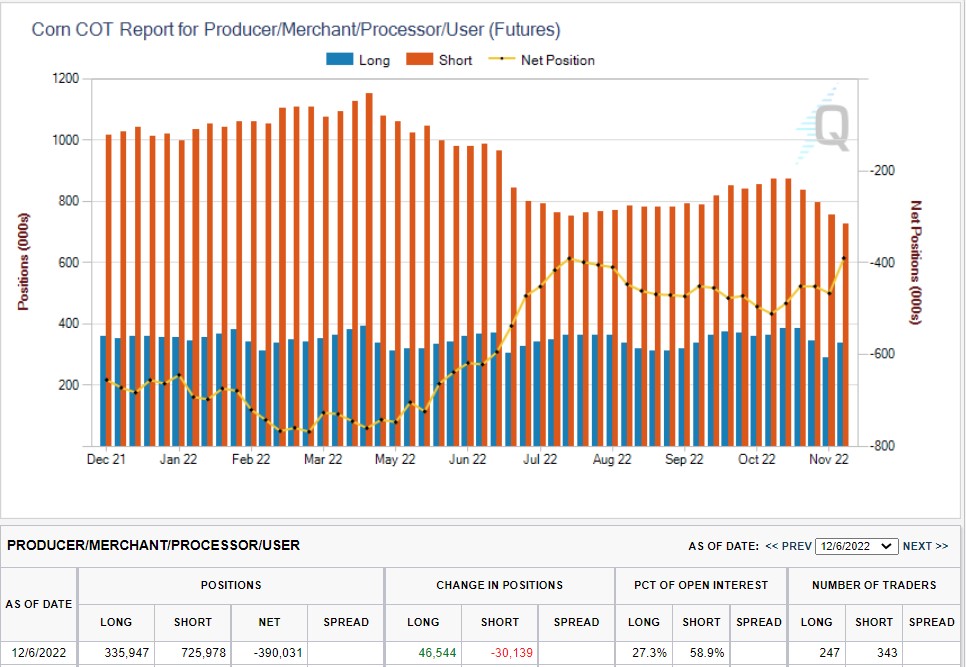
Source: CME Group
Another view of commercial interest shows that the commercial's short positions have reduced consistently for the past four weeks (red vertical bars are declining). At the same time, their total short positions are at a 12-month low.
The table under the chart shows that the commercials added 46K new long positions last week.
Both of these views of the COT report appear to be bullish behavior on the commercial traders' part.
Summary
We may see commercial interest at these higher levels because of the ethanol production needed for the upcoming driving season. Corn is a by-product of ethanol.
There are other reasons for the increased demand for corn. Corn continues to be exported throughout the winter, and livestock consumes corn in feedlots. The issue is that corn's supply is not replenished during this period. Other uses include corn oil for cooking and corn syrup for different recipes. All of this demand depletes corn supply and contributes to rising corn prices.
More Stock Market News from Barchart
- Stocks Close Higher as U.S. Consumer Prices Moderate
- Shorting Tech Stocks May Remain Profitable Next Year
- Stocks HIgher on Fed-Friendly U.S. CPI Report
- Berkshire Hathaway Remains an Excellent Long-Term Buy for Cost-Conscious Investors
On the date of publication, Don Dawson did not have (either directly or indirectly) positions in any of the securities mentioned in this article. All information and data in this article is solely for informational purposes.
/Microsoft%20headquarters%20By%20Peter.jpeg)

/Amazon%20-%20Image%20by%20bluestork%20via%20Shutterstock.jpg)
/A%20close-up%20of%20the%20Broadcom%20logo%20on%20a%20smartphone%20by%20Timon%20via%20Adobe%20Stock.jpeg)