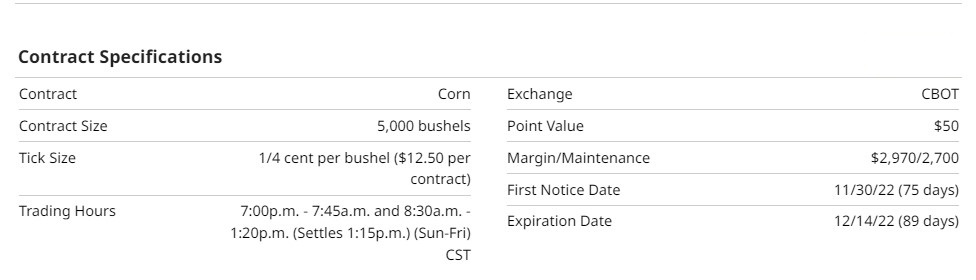
Specifications and statistics
The corn futures contracts were amongst the original contracts traded on the Chicago Board of Trade (CBOT) exchange some 200 years ago. Since then, it has become the most significant agricultural product traded on the CBOT. Through acquisitions and mergers over the years, the CBOT is part of the Chicago Mercantile Exchange Group (CMEGroup).
Today, the USA is the largest producer of corn, followed closely by Brazil. The corn belt in the USA gets one harvest per year, while Brazil has two seasons. Traders should follow the Brazillian Real currency during their harvest seasons. A weaker Real will make Brazillian corn more attractive for foreign purchase creating competition for USA corn.
Corn futures are very liquid, with average daily volume exceeding 250K contracts and open interest above 1.3 million contracts.
As of this writing, the front month December corn contract is trading at $6.70 per bushel, making the contract's notional value $33,500. The required margin to trade corn is $2,700 per contract, creating leverage of 12:1. To help you understand margin here is an article I wrote for Barchart.
Recent performance
During the recent month, corn has had an impressive +10% return with year-to-date returns of +24%. Traditionally corn puts its seasonal low closer to October, but this season saw an early low that would generally indicate a strong market.
Fundamentals impacting market behavior
On September 12, the National Agricultural Statistics Service (NASS) released its crop production report showing less corn than anticipated:
"Corn production for grain is forecast at 13.9 billion bushels, down 3 percent
from the previous forecast and down 8 percent from 2021. Based on conditions
as of September 1, yields are expected to average 172.5 bushels per harvested
acre, down 2.9 bushels from the previous forecast and down 4.5 bushels from
last year."
The Ukraine war has slowed the world's third-largest corn exporter, causing a corn shortage for many countries and pressuring the USA and Brazilian corn crops to meet those needs.
Spreads
A popular intra-market spread is the December 2022 / December 2023 spread. Looking at this spread, we can see it is trading at a positive number. A positive spread means the market is in backwardation. Backwardation occurs when market participants perceive a shortage of a commodity and higher than usual demand. A very bullish scenario is present during backwardation. The near-month contract (December 22) is priced higher than the distant month (December 23), trading in backwardation. This spread has been in backwardation since early 2021. For now, this spread supports long-term bullish positions.
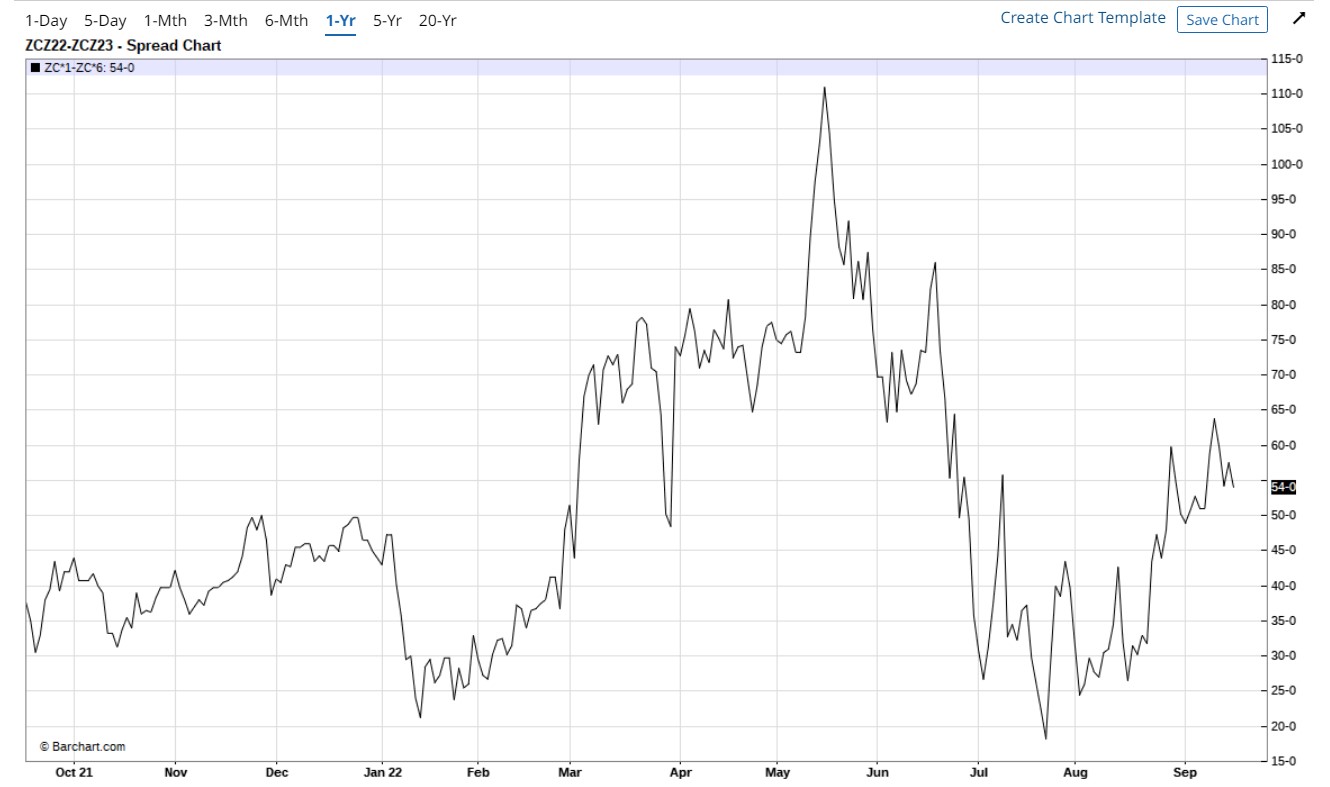
Source: Barchart
Technicals
Corn found some resistance that came from a weekly chart close in May. I cannot predict that this resistance will cause corn prices to reverse the trend permanently, but it temporarily stopped the uptrend. Since the double bottom pattern in July, corn has made higher highs and higher lows. Considering corn has rallied +10% over the last month, the market may need to correct some of its recent gains before resuming the uptrend.
An area of interest is the lower green line which was price resistance, but now that price has broken through it, the returning price could find support in this area when it returns.
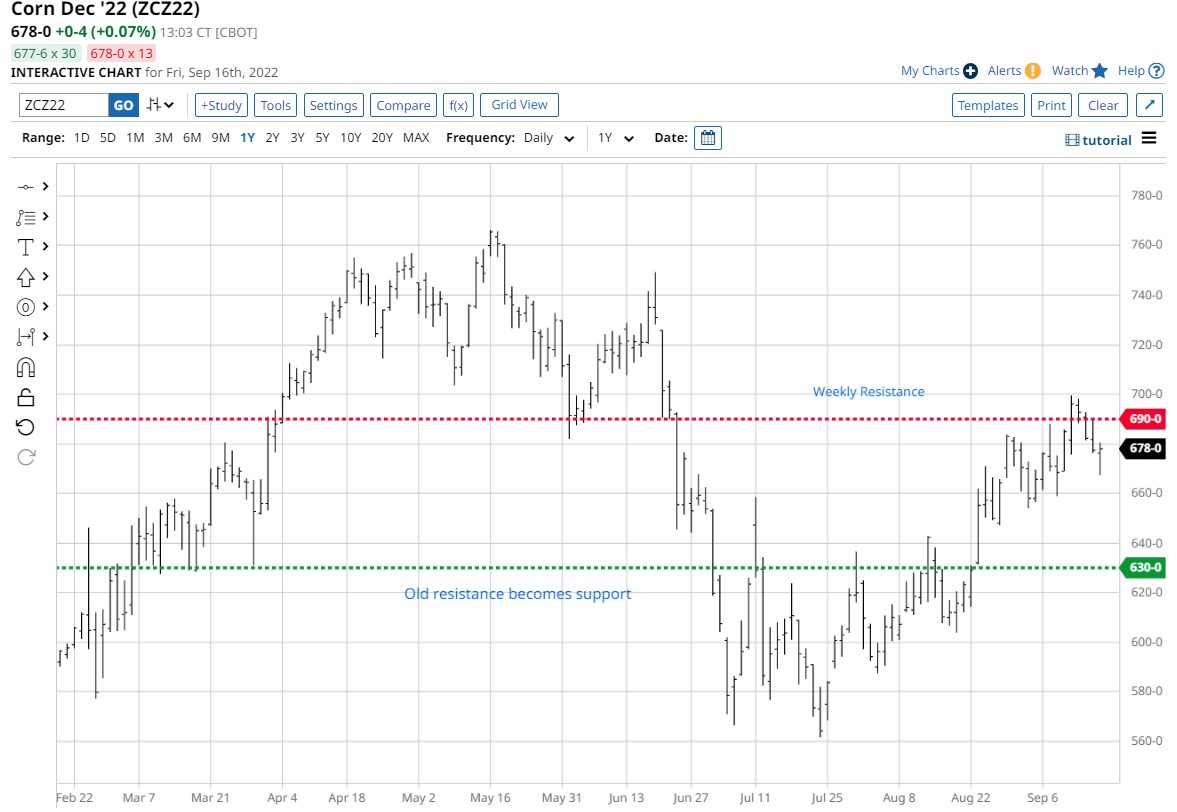
Source: Barchart
Seasonality
An article I wrote for Barchart discusses seasonality. Research that I follow by Moore Reseach Center, Inc (MRC) shows that cash corn usually makes its seasonal low for the year in late September to early October. MRCI had made a statement about overall markets that make early seasonal lows:
"Cycle theory suggests that an early price bottom before the seasonal low indicates a bullish environment."
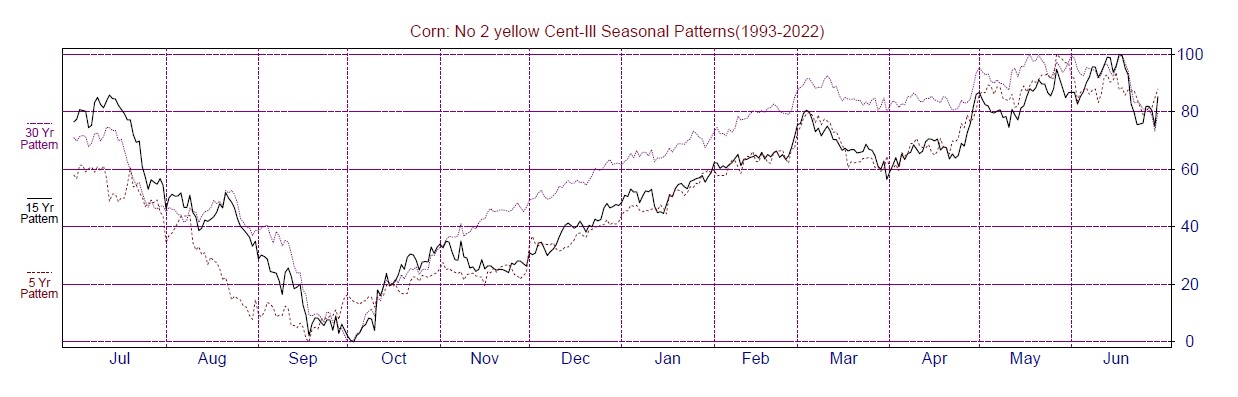
Source: MRCI
The Commitment of Traders (COT) report analysis
In a recent article I wrote for Barchart, I discussed how you could use the COT report to confirm seasonal patterns. Notice in July that the red line was trending up as corn found a bottom. This was commercial traders buying during that period. The green line (large speculators) was trending lower as they were selling into this low and performing the role that speculators provide liquidity for commercial traders. This year confirms that the seasonal low may be in place for corn.
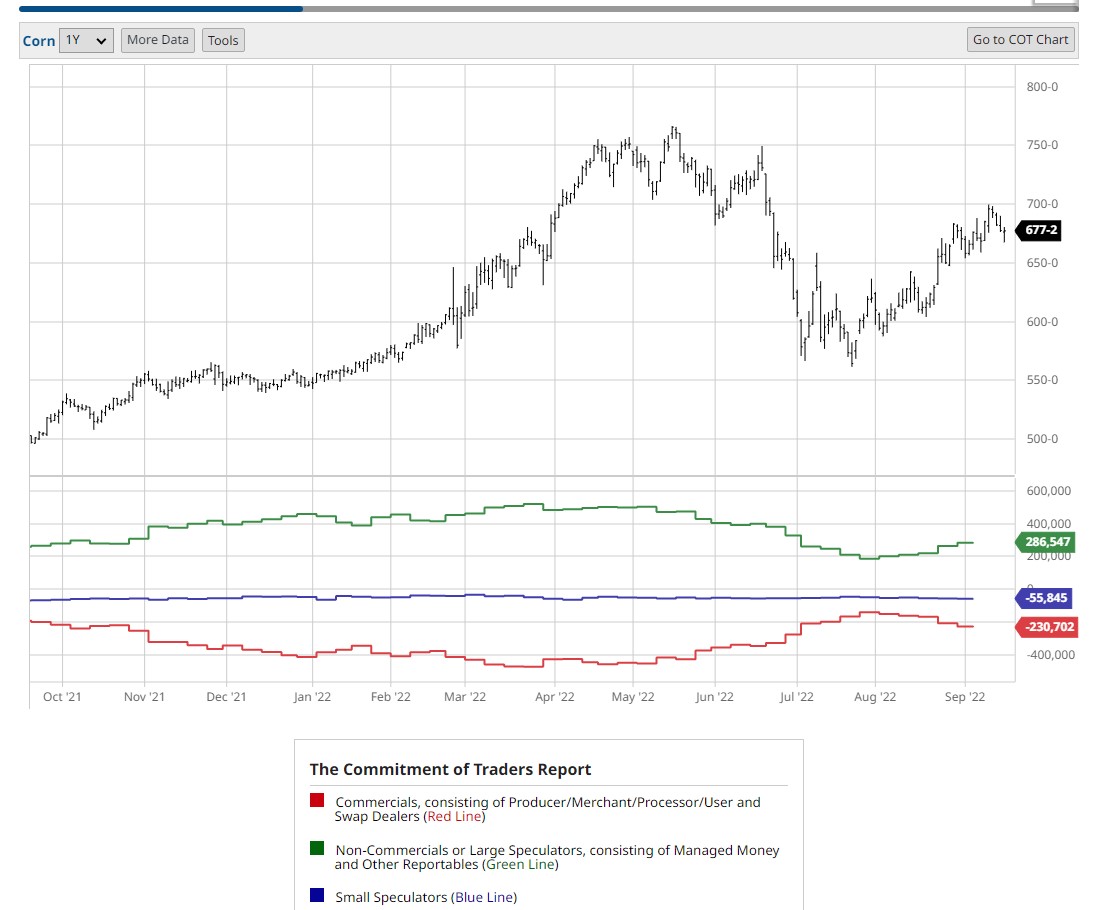
Source: Barchart
Related ETFs and mini contracts to participate
The standard corn contract (ZC) is one choice to trade. There is also a mini corn contract (XN) if the risk is too significant using the ZC contract.
ETFs to consider could be CORN, that only tracks the corn futures price. Or, for grain diversification, you may try DBA, which is like an index of grains and tracks multiple agricultural products.
For more specifications on these products, you can visit Barchart.com and type the symbol at the top of the page.
Disclaimer
"Always perform your due diligence when trading new or unfamiliar products."
My intent in this report was not to give trading advice but simply some research to support your trading strategy.
As of this writing, I did not have a position in the corn market.
Summary
I am bullish on the corn market in the long term, but I do expect some price retracement before resuming the uptrend. One thing that could distort this setup is what happens in the equity markets. You're probably wondering why that would matter.
There is an abundance of leverage used in equities and futures alike. If, for some reason, the equity markets begin to fall precipitously, resulting in massive margin calls, managed money accounts will be forced to liquidate winning positions in other assets to cover their current losses.
Another event approaching soon is the end of the third quarter, September 30. End-of-quarter trading can be a little more volatile than usual due to fund managers shuffling their portfolios to dress up their quarterly performance results, which will be sent to their investors.
Depending on the outcome of these two events, I believe they could impact the corn market rally.
More Grain News from Barchart
/Microsoft%20headquarters%20By%20Peter.jpeg)

/Amazon%20-%20Image%20by%20bluestork%20via%20Shutterstock.jpg)
/A%20close-up%20of%20the%20Broadcom%20logo%20on%20a%20smartphone%20by%20Timon%20via%20Adobe%20Stock.jpeg)