
The futures markets are comprised of two categories of traders: hedgers and speculators.
The CMEGroup exchange defines these as:
Hedgers (Commercial) - A hedger is any individual or firm that buys or sells the actual physical commodity. Many hedgers are producers, processors/refiners, wholesalers, retailers, or manufacturers and are affected by changes in commodity prices, exchange rates, and interest rates. Changes to any of these variables can impact a firm's bottom line when they bring goods to the market. To minimize the effects of these changes, hedgers will utilize futures contracts.
Speculators (Non-Commercial) - A speculator is any individual or firm that accepts risk to profit. Speculators can be individual traders, proprietary trading firms, portfolio managers, hedge funds, or market makers.
Each futures market has a reportable size (number of open positions) set by the Commodity Futures Trading Commission (CFTC). Futures Commission Merchants (FCMs) and clearing firms (brokers) report daily to the CFTC the number of open positions exceeding reportable position amounts. Speculators are then broken down into two sub-categories, large and small speculators. All traders exceeding the reportable amount will be reported as large speculators (reportable). The remaining traders will be considered small speculators (non-reportable).
Legacy Commitment of Traders Report
Since 1962, the CFTC has released the Commitment of Traders (COT) report. There have been many changes and additions to the report since it started. Today, the COT report is available at no charge every week. Generally, the data in the COT reports is from Tuesday and released Friday at 15:30 ET. The CFTC receives the data from the reporting firms on Wednesday morning and then corrects and verifies the data for release by Friday afternoon.
The mission of the CFTC is to promote the integrity, resilience, and vibrancy of the U.S. derivatives markets through sound regulation. One of the purposes of the Legacy COT report is to provide transparency into the participants' positions in the futures markets and to help the public better understand market dynamics.
Multiple COT reports are available, but we will focus on the Legacy COT report, as this was the original COT report and the most widely followed.
The table below is a sample of the weekly COT report released by the CFTC. At first glance, the information seems overwhelming and hard to decipher. Fortunately, some sources take this data and build readable charts that we can use for our COT analysis. My intention for showing this report is to show you the basis for the data in the charts used for COT analysis.
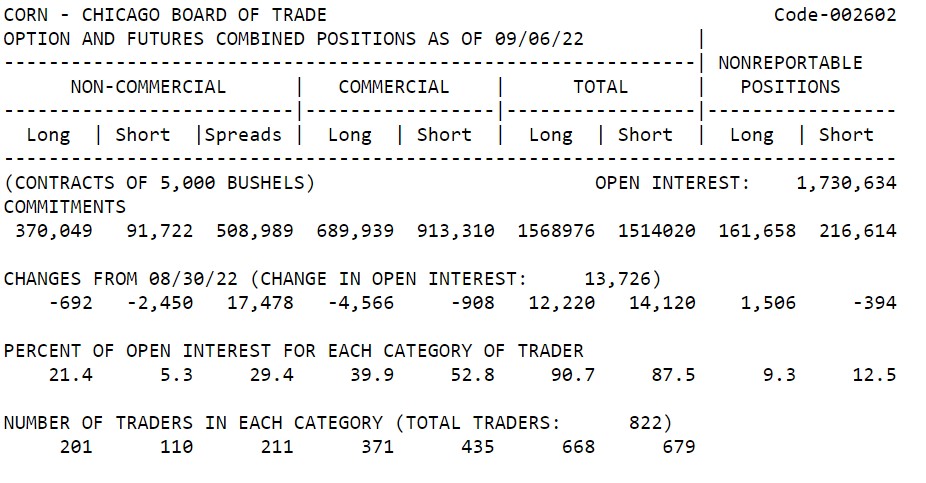
Source: CFTC.gov
I want to point out how this data confirms who the prominent players are in the futures markets. The COT report shows the large speculators (non-commercial), commercial, and small speculators (non-reportable) positions in the market based on both long and short open positions. Looking at the row "Percent of open interest for each category of trader," it's evident that the commercial trader holds the most significant percentage of the cumulative open interest. Confirming that the futures markets were initially created for commercial traders over 200 hundred years ago, and today are still the most significant participants.
Using the commercial trader column as an example, let's look at the columns of long and short positions held by the commercials. The number of actual longs held is 689,939 contracts. The number of actual shorts is 913,310 contracts. The COT charts we will use show the commercial traders' net position. The net position is the long contracts subtracted from the short contracts resulting in a net short or long position. I.E., 689,939 - 913,310 = - 223371 net short position
Barchart provides a summary Legacy COT report of net positions for a quick view of how commercial and large speculators are positioned in the market.
Viewing a COT Legacy Chart
Barchart provides COT charts in multiple formats to allow for more detailed viewing or scanning through flip charts.
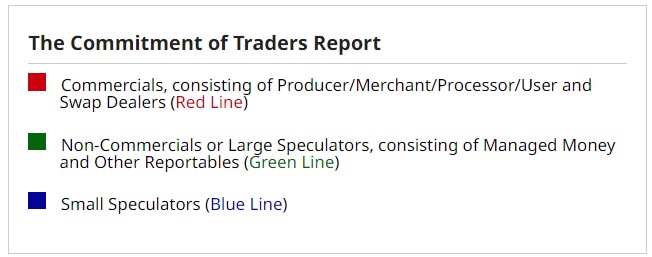
When viewing Barchart COT charts, the legend will be in the above table format.
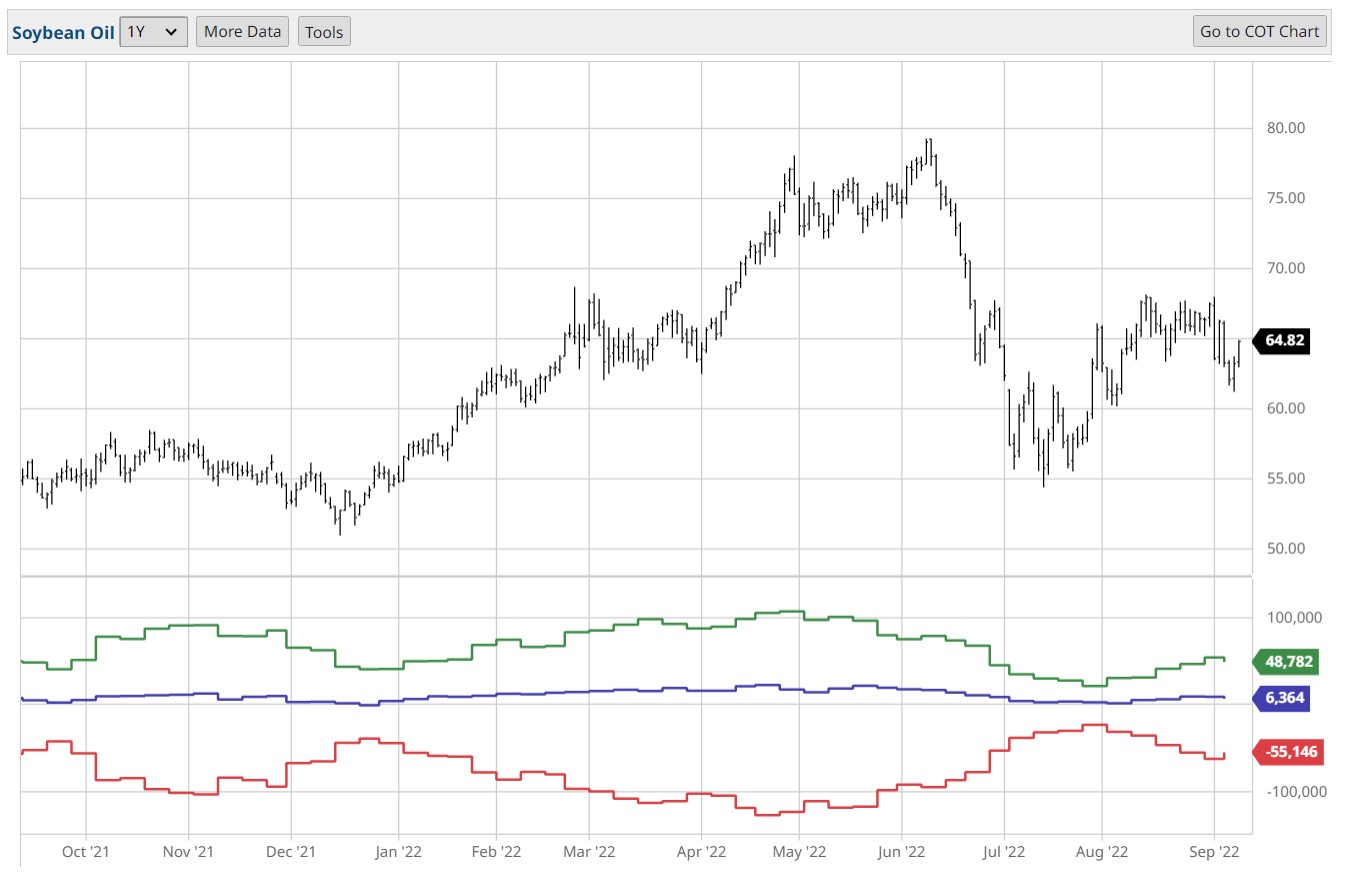
COT charts are only available on daily and higher timeframes. I've chosen one year, but there are many different periods available. COT charts should not be used as a timing tool; another type of analysis is required for proper market timing. Here is a daily COT chart of soybean oil, looking back at one year.
The primary participants we want to focus on are the commercial and large speculators. The small speculator (blue line) usually does not have much impact on the market. The numbers in the green (large speculators) and red (commercial) boxes are the net positions held as of the most recent reporting period.
A popular way to analyze market sentiment is to look at the current net position of the large speculator in relation to the past year of COT analysis; if their current net position is at the highest point for the past year, that could be considered bearish because of so many speculative long positions.
When the current large speculator's net position is at the lowest point for the past year of the COT analysis, that could be considered bullish because of so many speculative short positions.
Many large speculators are trend followers. Notice how the green line goes up when the price goes up, illustrating new long positions added by the large speculators during the up trend. The opposite is true; the green line goes down when prices go down—showing large speculators adding to short positions in downtrends. When the large speculators' net position is between these yearly extremes, you can see the weekly trends of these large speculators—also known as bullish or bearish market sentiment.
In a recent article I wrote for Barchart, I discussed seasonality. In my opinion, the consumer creates most seasonal patterns by buying indirectly from the commercials, which need to produce the product for this demand. By using seasonality in conjunction with the COT report, a trader can enhance the probabilities of a trade.
Reviewing the soybean oil COT chart, we can see the commercials (red line) were buying (up trending line) in late October and November. Then, coming into April and May, the commercials had been selling (declining red line).
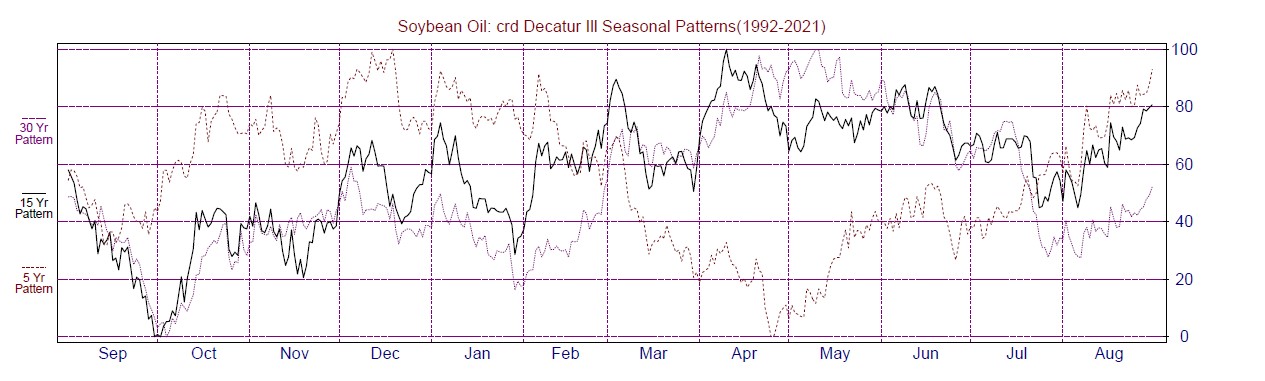
Source: Moore Research Center, Inc. (MRCI)
Seasonal patterns do not always work, but combining the confluence of commercial activity enhances that seasonal pattern. The above cash soybean oil chart depicts that the seasonal lows usually occur in late October and seasonal highs in April/May. Confirming that the COT report showed commercial activity supporting these seasonal highs and lows for this particular season.
Unfortunately, the Legacy COT report does not work as well for the financial markets as it does for the commodity markets. There are other COT reports to analyze this sector that I will write about in the future.
The examples I used for the COT report are just a few of the many ways to analyze the markets using the COT report. For traders looking for legal insider information on what big money is doing in the futures markets, I believe the COT report is worth some time to learn and understand.


/Broadcom%20Inc%20HQ%20photo-by%20Sundry%20Photogrpahy%20via%20iStock.jpg)
/An%20image%20of%20a%20Tesla%20humanoid%20robot%20in%20front%20of%20the%20company%20logo%20Around%20the%20World%20Photos%20via%20Shutterstock.jpg)
/AI%20(artificial%20intelligence)/3D%20Graphics%20Concept%20Big%20Data%20Center%20by%20Gorodenkoff%20via%20Shutterstock.jpg)